
Seller's Agent in 2025
Christopher Gordon
Bickerstaff Parham, LLC
(706) 442-4224
23 in this area
88 Total Sales
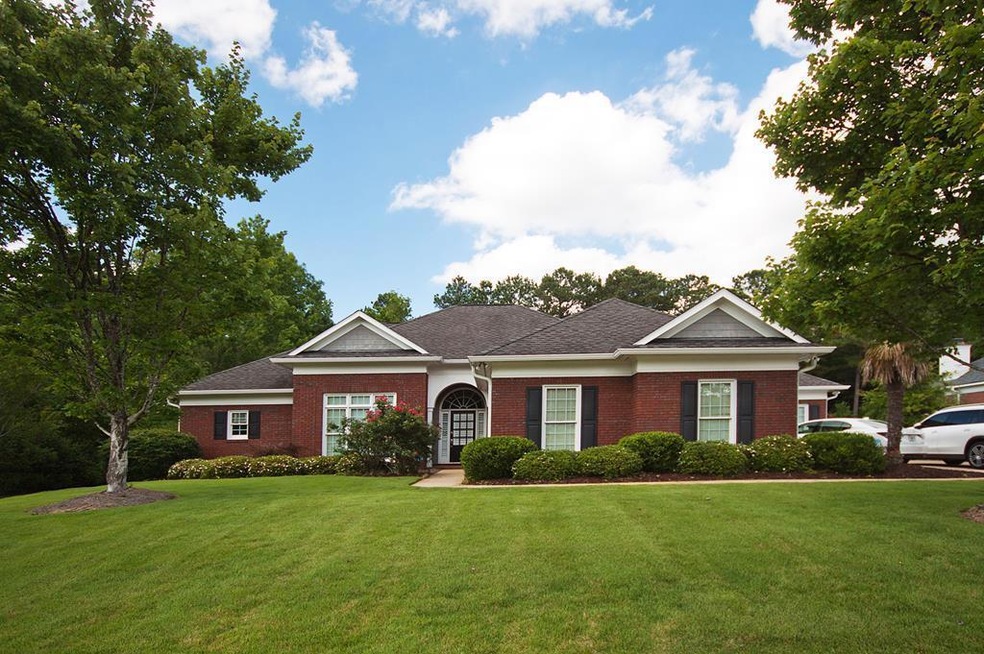
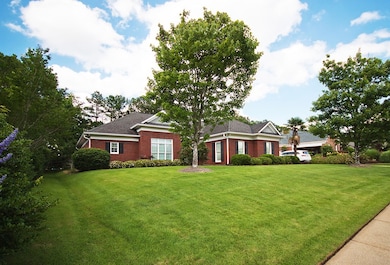
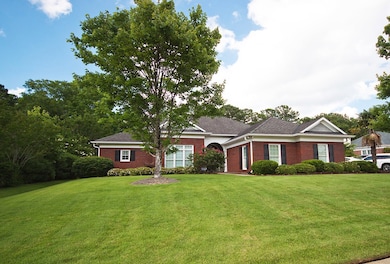

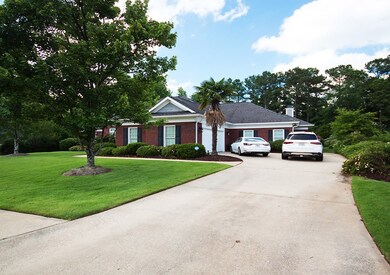
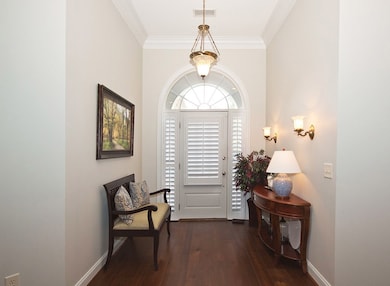
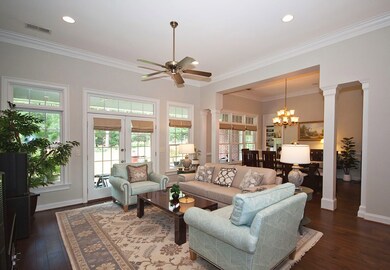
Welcome home to Maple Ridge! Take a look at this custom all brick 4 bedroom, 3 bathroom home located on a quiet cul-de-sac in the desirable Maple Ridge subdivision. You will love the soaring ceilings and all of the natural light as you enter the formal living room that is open to the large dining room. The gorgeous chef's kitchen is open to the keeping room making this the perfect home for entertaining. The kitchen offers beautiful granite countertops, s/s appliances to include Bosch double ovens, as well as a 5 burner gas cooktop. There's also a breakfast area and tons of storage. The keeping room has a cozy gas fireplace and lovely built-ins. There are gorgeous hardwood floors throughout the living areas to include Brazilian hardwoods in all 4 bedrooms. The large primary suite has a trey ceiling, large walk in closet, and an en-suite bath with double vanities separate shower and garden tub. Two of the other bedrooms share a Jack & Jill bath while the guest room is conveniently located on the other side of the house. Out back you will find a sizeable covered patio overlooking the lush landscaping in the fenced private backyard with all new grass. A few other unique features is the surround sound in the living room, keeping room, dining room, & patio. There's even a storm shelter built into the garage floor that holds up to 6 people! This home truly has it all & is a must see! Call for your private tour today.
Last Agent to Sell the Property
Bickerstaff Parham, LLC Brokerage Phone: 7066531400 License #386273 Listed on: 06/11/2025
| Date | Type | Sale Price | Title Company |
|---|---|---|---|
| Special Warranty Deed | $549,900 | None Listed On Document | |
| Warranty Deed | $425,000 | -- | |
| Warranty Deed | $345,000 | -- | |
| Warranty Deed | $384,900 | None Available |
| Date | Status | Loan Amount | Loan Type |
|---|---|---|---|
| Open | $439,920 | New Conventional | |
| Previous Owner | $357,000 | New Conventional | |
| Previous Owner | $332,687 | VA | |
| Previous Owner | $345,000 | VA | |
| Previous Owner | $307,920 | New Conventional | |
| Previous Owner | $284,000 | New Conventional | |
| Previous Owner | $53,250 | Stand Alone Second |
| Date | Event | Price | List to Sale | Price per Sq Ft |
|---|---|---|---|---|
| 08/04/2025 08/04/25 | Sold | $549,900 | 0.0% | $187 / Sq Ft |
| 06/30/2025 06/30/25 | Pending | -- | -- | -- |
| 06/11/2025 06/11/25 | For Sale | $549,900 | -- | $187 / Sq Ft |
| Year | Tax Paid | Tax Assessment Tax Assessment Total Assessment is a certain percentage of the fair market value that is determined by local assessors to be the total taxable value of land and additions on the property. | Land | Improvement |
|---|---|---|---|---|
| 2025 | $6,139 | $225,840 | $20,388 | $205,452 |
| 2024 | $614 | $225,840 | $20,388 | $205,452 |
| 2023 | $548 | $225,840 | $20,388 | $205,452 |
| 2022 | $6,401 | $170,000 | $20,200 | $149,800 |
| 2021 | $4,536 | $123,740 | $20,388 | $103,352 |
| 2020 | $4,537 | $123,740 | $20,388 | $103,352 |
| 2019 | $4,553 | $124,484 | $20,388 | $104,096 |
| 2018 | $4,553 | $124,484 | $20,388 | $104,096 |
| 2017 | $5,116 | $124,484 | $20,388 | $104,096 |
| 2016 | $5,793 | $153,704 | $16,800 | $136,904 |
| 2015 | $5,800 | $153,704 | $16,800 | $136,904 |
| 2014 | $5,808 | $153,704 | $16,800 | $136,904 |
| 2013 | -- | $153,704 | $16,800 | $136,904 |
Seller's Agent in 2025
Christopher Gordon
Bickerstaff Parham, LLC
(706) 442-4224
23 in this area
88 Total Sales
Buyer's Agent in 2025
Jean Pender
Re/max Champions Realty
(706) 464-5413
10 in this area
26 Total Sales
Source: Columbus Board of REALTORS® (GA)
MLS Number: 221579
APN: 079-010-036
Disclaimer: Certain information contained herein is derived from information provided by parties other than Homes.com. All information provided is deemed reliable, but is not guaranteed to be accurate and should be independently verified.
![]() IDX information is provided exclusively for personal, non-commercial use, and may not be used for any purpose other than to identify prospective properties consumers may be interested in purchasing. Information is deemed reliable but not guaranteed.
IDX information is provided exclusively for personal, non-commercial use, and may not be used for any purpose other than to identify prospective properties consumers may be interested in purchasing. Information is deemed reliable but not guaranteed.