Estimated Value: $672,000 - $778,336
5
Beds
5
Baths
4,249
Sq Ft
$174/Sq Ft
Est. Value
About This Home
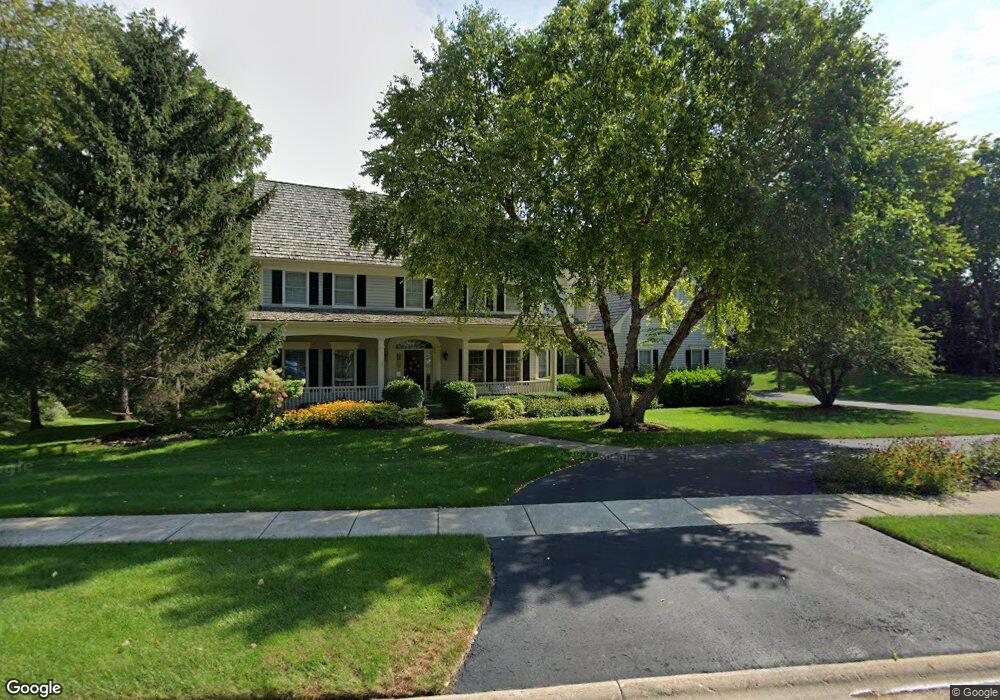
This home is located at 1013 Bridle Ln, Cary, IL 60013 and is currently estimated at $738,584, approximately $173 per square foot. 1013 Bridle Ln is a home located in McHenry County with nearby schools including Deer Path Elementary School, Cary Jr High School, and Cary Grove High School.
Ownership History
Date
Name
Owned For
Owner Type
Purchase Details
Closed on
May 28, 2010
Sold by
Varano Brian K and Varano Sandra K
Bought by
Kendeigh Paul S and Kendeigh Tracy L
Current Estimated Value
Home Financials for this Owner
Home Financials are based on the most recent Mortgage that was taken out on this home.
Original Mortgage
$417,000
Outstanding Balance
$281,795
Interest Rate
5.14%
Mortgage Type
New Conventional
Estimated Equity
$456,789
Purchase Details
Closed on
Jun 15, 2000
Sold by
Harris Bank Barrington
Bought by
Varano Brian K and Varano Sandra K
Home Financials for this Owner
Home Financials are based on the most recent Mortgage that was taken out on this home.
Original Mortgage
$400,000
Interest Rate
8%
Purchase Details
Closed on
Feb 13, 1998
Sold by
Home State Bank National Assn
Bought by
Harris Bank Of Barrington Na
Create a Home Valuation Report for This Property
The Home Valuation Report is an in-depth analysis detailing your home's value as well as a comparison with similar homes in the area
Home Values in the Area
Average Home Value in this Area
Purchase History
| Date | Buyer | Sale Price | Title Company |
|---|---|---|---|
| Kendeigh Paul S | $527,000 | First American Title Ins Co | |
| Varano Brian K | $500,000 | -- | |
| Harris Bank Of Barrington Na | -- | -- |
Source: Public Records
Mortgage History
| Date | Status | Borrower | Loan Amount |
|---|---|---|---|
| Open | Kendeigh Paul S | $417,000 | |
| Previous Owner | Varano Brian K | $400,000 | |
| Closed | Varano Brian K | $50,000 |
Source: Public Records
Tax History Compared to Growth
Tax History
| Year | Tax Paid | Tax Assessment Tax Assessment Total Assessment is a certain percentage of the fair market value that is determined by local assessors to be the total taxable value of land and additions on the property. | Land | Improvement |
|---|---|---|---|---|
| 2024 | $17,301 | $213,440 | $38,780 | $174,660 |
| 2023 | $16,930 | $190,895 | $34,684 | $156,211 |
| 2022 | $15,699 | $173,662 | $77,055 | $96,607 |
| 2021 | $14,990 | $161,787 | $71,786 | $90,001 |
| 2020 | $14,560 | $156,060 | $69,245 | $86,815 |
| 2019 | $14,291 | $149,368 | $66,276 | $83,092 |
| 2018 | $15,974 | $162,121 | $61,225 | $100,896 |
| 2017 | $15,703 | $152,728 | $57,678 | $95,050 |
| 2016 | $17,438 | $159,162 | $54,097 | $105,065 |
| 2013 | -- | $149,126 | $50,466 | $98,660 |
Source: Public Records
Map
Nearby Homes
- 1055 White Pine Dr
- 945 White Pine Dr
- 406 Catkins Way
- 0000 Newbold Rd
- 380 Merion Dr
- 312 Wooded Knoll Dr
- 1712 Squirrel Trail
- Lot 7 Hickory Nut Grove Rd
- 902 Spring Beach Way
- 0 Three Oaks Dr Unit MRD12417647
- 326 Alicia Dr
- 305 Bell Dr
- 28413 W Harvest Glen Cir
- 515 Crest Dr
- 305 Pearl St
- 24744 N Golden Oat Cir
- LOT 02 Three Oaks Rd
- 365 Oakmont Dr
- 28971 W Fox St
- 1107 Spring Beach Way
- 820 3 Oaks Rd
- 1014 Bridle Ln
- 807 3 Oaks Rd
- 1006 Bridle Ln
- 1002 3 Oaks Rd
- 995 Prairie Hill Ct
- 811 3 Oaks Rd
- 915 Bridle Ln
- 975 Prairie Hill Ct
- 812 3 Oaks Rd
- 918 Bridle Ln
- 1005 3 Oaks Rd
- 960 Lyons Ridge Dr
- 805 3 Oaks Rd
- 805 3 Oaks Rd
- 955 Prairie Hill Ct
- 950 Lyons Ridge Dr
- 1012 Three Oaks Rd
- 1012 3 Oaks Rd
- 7508 S Rawson Bridge Rd