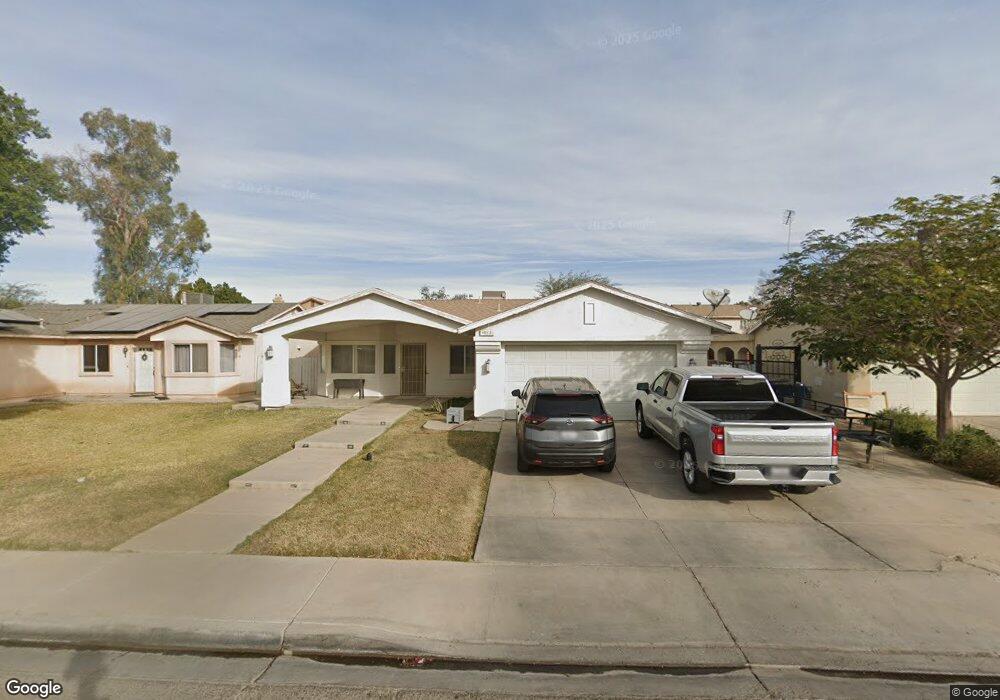
1013 Desert View St Calexico, CA 92231
Estimated Value: $356,000 - $423,000
4
Beds
--
Bath
1,630
Sq Ft
$242/Sq Ft
Est. Value
About This Home
This home is located at 1013 Desert View St, Calexico, CA 92231 and is currently estimated at $394,793, approximately $242 per square foot. 1013 Desert View St is a home located in Imperial County with nearby schools including Blanche Charles Elementary School, William Moreno Junior High School, and Calexico High School.
Ownership History
Date
Name
Owned For
Owner Type
Purchase Details
Closed on
Feb 15, 2023
Sold by
Loo Norma Alicia
Bought by
Loo Norma Alicia
Current Estimated Value
Purchase Details
Closed on
Jan 26, 2023
Sold by
Alicia Loo Trust
Bought by
Family Trust and Alex And Celia Loo 1996 Trust
Purchase Details
Closed on
Dec 16, 2021
Sold by
Alex Loo And Celia Loo 1996 Family Trust
Bought by
Alex And Celia Loo 1996 Trust
Purchase Details
Closed on
Oct 31, 2011
Sold by
Ibarra Manuel and Ibarra Margarita
Bought by
Loo Alex and Loo Celia
Purchase Details
Closed on
Oct 10, 2011
Sold by
Loo Alex and Loo Celia
Bought by
Loo Alex and Loo Celia
Purchase Details
Closed on
Oct 6, 1999
Sold by
Ayala Arturo and Gomez Marcia L
Bought by
Ibarra Manuel and Ibarra Margarita
Home Financials for this Owner
Home Financials are based on the most recent Mortgage that was taken out on this home.
Original Mortgage
$96,662
Interest Rate
7.77%
Mortgage Type
FHA
Create a Home Valuation Report for This Property
The Home Valuation Report is an in-depth analysis detailing your home's value as well as a comparison with similar homes in the area
Purchase History
We collect this data history from publicly available records. To have your information removed, we recommend requesting removal directly through your county’s website.
| Date | Buyer | Sale Price | Title Company |
|---|---|---|---|
| Loo Norma Alicia | -- | None Listed On Document | |
| Family Trust | -- | Orange Coast Title | |
| Loo Adalberto Alejandro | -- | None Listed On Document | |
| Alex And Celia Loo 1996 Trust | -- | Horton Knox Carter & Foote Llp | |
| Loo Alex | $103,051 | None Available | |
| Loo Alex | -- | None Available | |
| Ibarra Manuel | $115,000 | Commonwealth Land Title Ins |
Source: Public Records
Mortgage History
We collect this data history from publicly available records. To have your information removed, we recommend requesting removal directly through your county’s website.
| Date | Status | Borrower | Loan Amount |
|---|---|---|---|
| Previous Owner | Ibarra Manuel | $96,662 | |
| Closed | Ibarra Manuel | $19,822 |
Source: Public Records
Tax History
| Year | Tax Paid | Tax Assessment Tax Assessment Total Assessment is a certain percentage of the fair market value that is determined by local assessors to be the total taxable value of land and additions on the property. | Land | Improvement |
|---|---|---|---|---|
| 2025 | $3,656 | $301,140 | $52,055 | $249,085 |
| 2023 | $3,656 | $124,942 | $24,140 | $100,802 |
| 2022 | $1,533 | $122,493 | $23,667 | $98,826 |
| 2021 | $1,488 | $120,092 | $23,203 | $96,889 |
| 2020 | $1,433 | $118,862 | $22,966 | $95,896 |
| 2019 | $1,392 | $116,532 | $22,516 | $94,016 |
| 2018 | $1,379 | $114,248 | $22,075 | $92,173 |
| 2017 | $1,279 | $112,009 | $21,643 | $90,366 |
| 2016 | $1,221 | $109,814 | $21,219 | $88,595 |
| 2015 | $1,200 | $108,166 | $20,901 | $87,265 |
| 2014 | $1,171 | $106,048 | $20,492 | $85,556 |
Source: Public Records
Map
Nearby Homes
- 1012 Desert View St
- 1253 Rainbow Ave
- 977 Salvador Guilin St Unit 4
- 956 Salvador Guilin St
- 904 Salvador Guilin St
- 801 Villa Grande St
- 936 Nosotros St
- 1324 River Dr
- 1040 Grant St
- 728 Lincoln St
- 530 W Birch St
- 937 Lacy Ave
- 0 Beech Canal Gate 15 Unit 24368695IC
- 0 Hwy 98 and Andrade Ave Unit PTP2507850
- 0 Sec Carr Rd & Rood Rd Unit 24358721IC
- 0 Tierra Santa Subdivision Unit PTP2603092
- 0 Tierra Santa Subdivision Unit PTP2603094
- 0 Tierra Santa Subdivision Unit PTP2603093
- 1119 Imperial Ave W
- 14 Grant St
- 1009 Skyline St
- 1013 Skyline St
- 1005 Skyline St
- 1008 Valley St
- 1004 Valley St
- 1012 Valley St
- 1017 Skyline St
- 1001 Skyline St
- 1016 Valley St
- 1000 Valley St
- 1008 Skyline St
- 1012 Skyline St
- 1004 Skyline St
- 1021 Skyline St
- 1016 Skyline St
- 1000 Skyline St
- 1020 Valley St
- 1025 Skyline St
- 1020 Skyline St
- 1024 Valley St
Your Personal Tour Guide
Ask me questions while you tour the home.