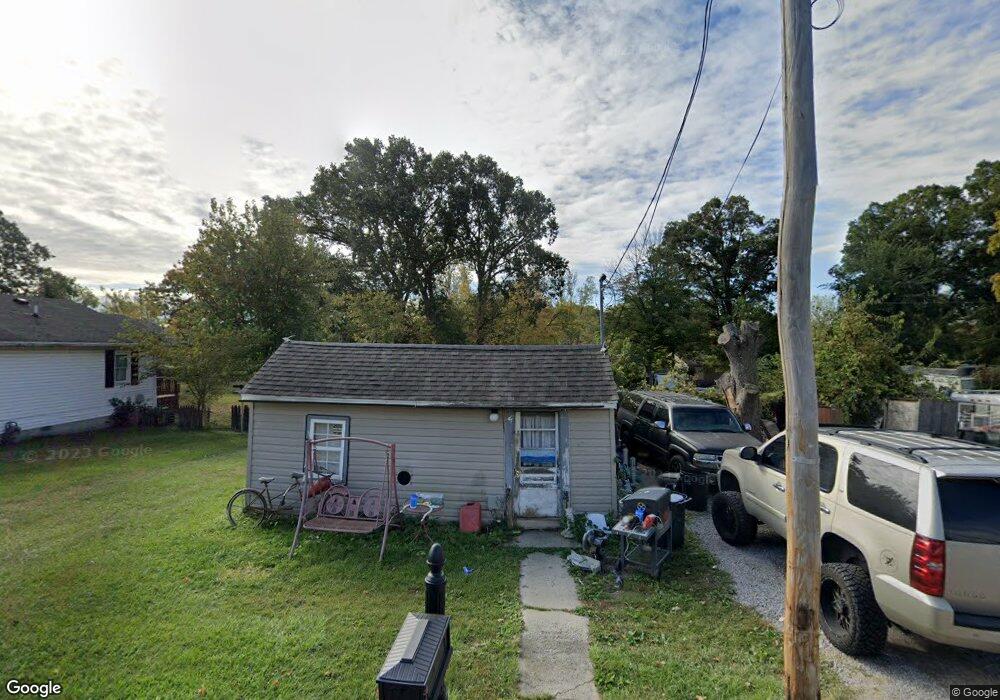
1013 Drexel Ave Marion, OH 43302
Estimated Value: $65,000 - $97,000
1
Bed
1
Bath
520
Sq Ft
$155/Sq Ft
Est. Value
About This Home
This home is located at 1013 Drexel Ave, Marion, OH 43302 and is currently estimated at $80,617, approximately $155 per square foot. 1013 Drexel Ave is a home located in Marion County with nearby schools including Pleasant Elementary School, Pleasant Middle School, and Pleasant High School.
Ownership History
Date
Name
Owned For
Owner Type
Purchase Details
Closed on
Mar 21, 2022
Sold by
Smith Linda A
Bought by
Sharp Levi G
Current Estimated Value
Purchase Details
Closed on
Sep 4, 2019
Sold by
Smith Linda A
Bought by
Sharp Levi G
Home Financials for this Owner
Home Financials are based on the most recent Mortgage that was taken out on this home.
Original Mortgage
$9,000
Interest Rate
3.7%
Mortgage Type
Land Contract Argmt. Of Sale
Purchase Details
Closed on
Nov 14, 2008
Sold by
Haymes Thomas and Stover Kathleen
Bought by
Smith Linda A
Purchase Details
Closed on
Apr 7, 2008
Sold by
Citifinancial Inc
Bought by
Stover Kathleen and Haymes Thomas
Purchase Details
Closed on
Aug 16, 2007
Sold by
Roberts John L
Bought by
Citifinancial Inc
Purchase Details
Closed on
Sep 22, 1997
Bought by
Smith Linda A
Create a Home Valuation Report for This Property
The Home Valuation Report is an in-depth analysis detailing your home's value as well as a comparison with similar homes in the area
Home Values in the Area
Average Home Value in this Area
Purchase History
| Date | Buyer | Sale Price | Title Company |
|---|---|---|---|
| Sharp Levi G | -- | None Listed On Document | |
| Sharp Levi G | $10,000 | None Available | |
| Smith Linda A | -- | None Available | |
| Stover Kathleen | $15,500 | Sally Chicago Title Agency | |
| Citifinancial Inc | $34,900 | None Available | |
| Smith Linda A | $10,400 | -- |
Source: Public Records
Mortgage History
| Date | Status | Borrower | Loan Amount |
|---|---|---|---|
| Previous Owner | Sharp Levi G | $9,000 |
Source: Public Records
Tax History Compared to Growth
Tax History
| Year | Tax Paid | Tax Assessment Tax Assessment Total Assessment is a certain percentage of the fair market value that is determined by local assessors to be the total taxable value of land and additions on the property. | Land | Improvement |
|---|---|---|---|---|
| 2024 | $217 | $4,710 | $2,160 | $2,550 |
| 2023 | $217 | $4,710 | $2,160 | $2,550 |
| 2022 | $217 | $4,710 | $2,160 | $2,550 |
| 2021 | $185 | $3,710 | $1,700 | $2,010 |
| 2020 | $183 | $3,710 | $1,700 | $2,010 |
| 2019 | $2 | $3,710 | $1,700 | $2,010 |
| 2018 | $2 | $3,500 | $1,790 | $1,710 |
| 2017 | $2 | $3,500 | $1,790 | $1,710 |
| 2016 | $2 | $3,500 | $1,790 | $1,710 |
| 2015 | $2 | $3,380 | $1,700 | $1,680 |
| 2014 | $2 | $3,380 | $1,700 | $1,680 |
| 2012 | $149 | $3,760 | $1,730 | $2,030 |
Source: Public Records
Map
Nearby Homes
- 1178 Cheney Ave
- 1406 Plantation Dr
- 1133 Amherst Dr
- 989 Davids St
- 981 Davids St
- 927 Bellefontaine Ave
- 0 Bellefontaine Ave
- 786 Sheridan Rd
- 772 Sheridan Rd
- 757 Merkle Ave
- 796 Woodrow Ave
- 720 Woodrow Ave
- 889 Oak Grove Ave
- 0 Independence Ave
- 950 Oak Grove Ave
- 668 Uncapher Ave
- 681 Davids St
- 625 Rochelle Dr
- 645 Henry St
- 2261 Talon Place
- 1007 Drexel Ave
- 1027 Drexel Ave
- 1027 Drexel Ave
- 993 Drexel Ave
- 1016 Drexel Ave
- 1036 van Atta Ave
- 987 Drexel Ave
- 1039 Drexel Ave
- 1039 Drexel Ave
- 996 Drexel Ave
- 996 Drexel Ave
- 1026 Drexel Ave
- 979 Drexel Ave
- 1535 Eustic Ave
- 982 Drexel Ave
- 1005 Olive Ave
- 1042 Drexel Ave
- 1011 Olive Ave
- 1015 Olive Ave
- 982 van Atta Ave