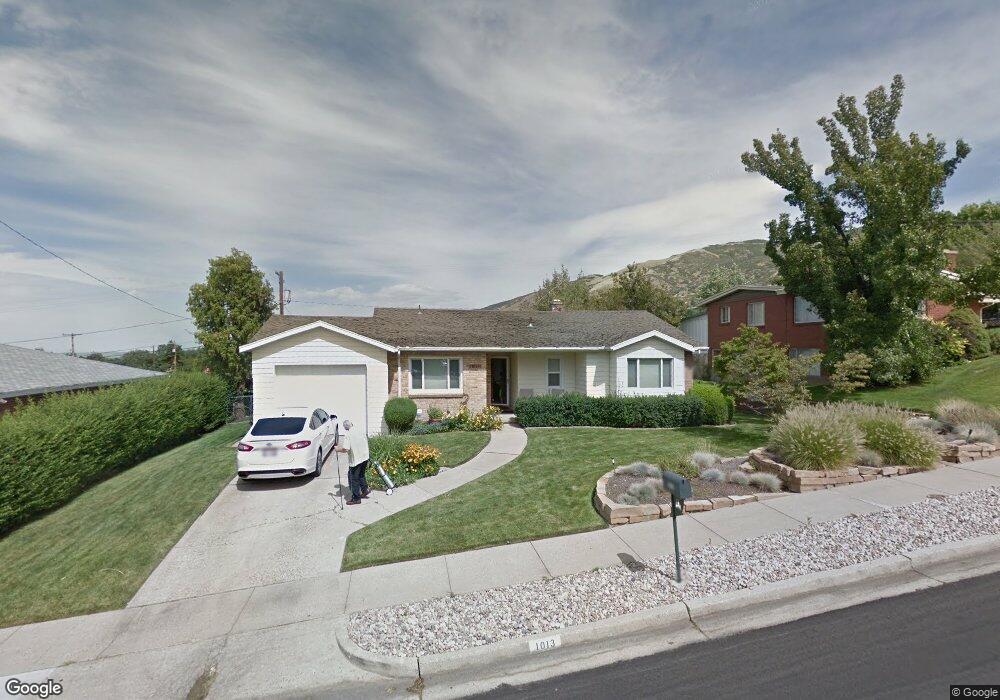
1013 E Center St Bountiful, UT 84010
Estimated Value: $448,034 - $556,000
3
Beds
1
Bath
1,167
Sq Ft
$414/Sq Ft
Est. Value
About This Home
This home is located at 1013 E Center St, Bountiful, UT 84010 and is currently estimated at $483,259, approximately $414 per square foot. 1013 E Center St is a home located in Davis County with nearby schools including Holbrook Elementary School, Millcreek Junior High School, and Bountiful High School.
Ownership History
Date
Name
Owned For
Owner Type
Purchase Details
Closed on
Aug 15, 2017
Sold by
Orchard Cidne Rossi
Bought by
Tingey Justin and Tingey Bethany
Current Estimated Value
Home Financials for this Owner
Home Financials are based on the most recent Mortgage that was taken out on this home.
Original Mortgage
$239,031
Outstanding Balance
$197,087
Interest Rate
3.88%
Mortgage Type
VA
Estimated Equity
$286,172
Purchase Details
Closed on
Nov 17, 2008
Sold by
Rossi John W and Rossi Diane W
Bought by
Rossi John W and Rossi Diane W
Purchase Details
Closed on
Jul 30, 2003
Sold by
Rossi John Wynn and Rossi John Eric
Bought by
Rossi John W and Rossi Diane W
Purchase Details
Closed on
Mar 28, 1997
Sold by
Rossi John Wynn and Rossi Diane W
Bought by
Rossi John Wynn and Rossi John Eric
Create a Home Valuation Report for This Property
The Home Valuation Report is an in-depth analysis detailing your home's value as well as a comparison with similar homes in the area
Purchase History
| Date | Buyer | Sale Price | Title Company |
|---|---|---|---|
| Tingey Justin | -- | Stewart Title | |
| Rossi John W | -- | None Available | |
| Rossi John W | -- | First American Title Co | |
| Rossi John Wynn | -- | Associated Title Company |
Source: Public Records
Mortgage History
| Date | Status | Borrower | Loan Amount |
|---|---|---|---|
| Open | Tingey Justin | $239,031 |
Source: Public Records
Tax History
| Year | Tax Paid | Tax Assessment Tax Assessment Total Assessment is a certain percentage of the fair market value that is determined by local assessors to be the total taxable value of land and additions on the property. | Land | Improvement |
|---|---|---|---|---|
| 2025 | $1,364 | $214,500 | $128,175 | $86,325 |
| 2024 | $1,269 | $210,650 | $118,263 | $92,387 |
| 2023 | $2,238 | $377,000 | $213,307 | $163,693 |
| 2022 | $2,312 | $213,950 | $113,427 | $100,523 |
| 2021 | $1,955 | $275,000 | $168,490 | $106,510 |
| 2020 | $1,716 | $241,000 | $153,444 | $87,556 |
| 2019 | $1,720 | $236,000 | $153,668 | $82,332 |
| 2018 | $1,611 | $217,000 | $142,404 | $74,596 |
| 2016 | $1,417 | $103,565 | $44,462 | $59,103 |
| 2015 | $1,416 | $97,846 | $43,863 | $53,983 |
| 2014 | $1,438 | $102,752 | $43,863 | $58,889 |
| 2013 | -- | $82,636 | $52,302 | $30,334 |
Source: Public Records
Map
Nearby Homes
- 6 N 800 E
- 1138 Briggs Dr
- 129 N 800 E
- 683 E 100 N
- 908 Northern Hills Dr Unit 3
- 933 Northern Hills Cir
- 331 S 1550 E Unit 3
- 456 E 500 S
- 513 N 400 E Unit 14B
- 520 S Orchard Dr Unit 17
- 144 Bountiful Blvd
- 453 N 400 E Unit 7-D
- 1342 E Skyline Dr N Unit 30
- 275 E Peach Ln S
- 255 E 400 S
- 323 Peach Ln
- 861 E Millbrook Way
- 111 Eagle Ridge Dr
- 357 S 100 E
- 795 Abby Ln Unit 5
Your Personal Tour Guide
Ask me questions while you tour the home.