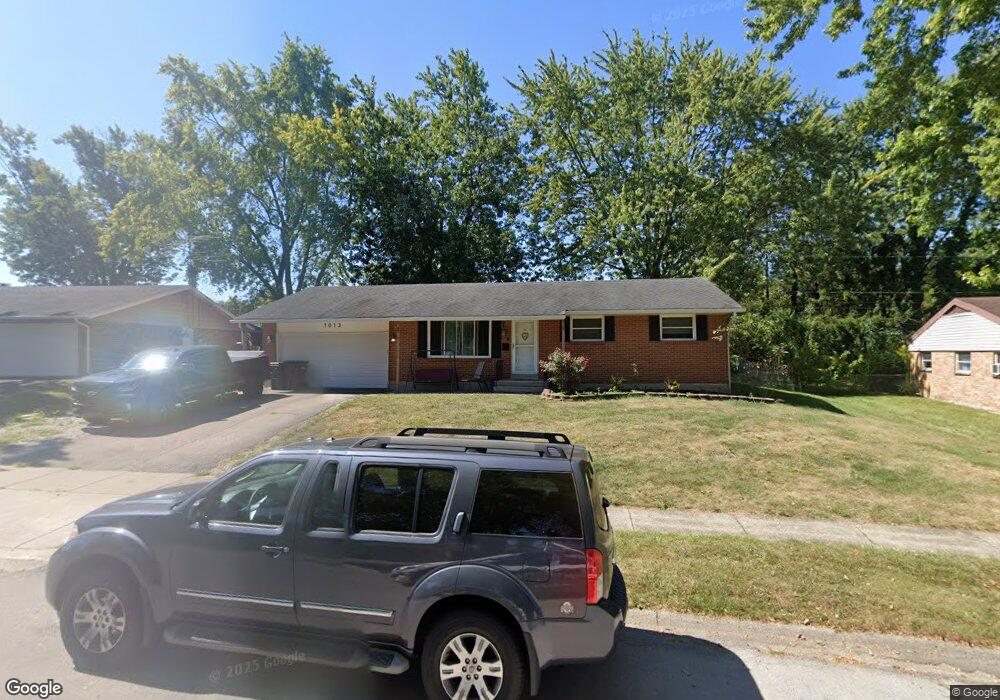
1013 Hazel Ave Englewood, OH 45322
Estimated Value: $183,000 - $214,000
3
Beds
1
Bath
1,233
Sq Ft
$161/Sq Ft
Est. Value
About This Home
This home is located at 1013 Hazel Ave, Englewood, OH 45322 and is currently estimated at $198,934, approximately $161 per square foot. 1013 Hazel Ave is a home located in Montgomery County with nearby schools including Englewood Hills Elementary School, Northmont High School, and Trotwood Preparatory & Fitness Academy.
Ownership History
Date
Name
Owned For
Owner Type
Purchase Details
Closed on
May 25, 2007
Sold by
Hobbs Travis J and Hobbs Briana M
Bought by
Blosser Roberta L
Current Estimated Value
Home Financials for this Owner
Home Financials are based on the most recent Mortgage that was taken out on this home.
Original Mortgage
$112,000
Outstanding Balance
$68,275
Interest Rate
6.21%
Mortgage Type
Purchase Money Mortgage
Estimated Equity
$130,659
Purchase Details
Closed on
May 20, 2004
Sold by
Loase Bradley J and Loase Dawn
Bought by
Hobbs Travis J and Killian Briana M
Home Financials for this Owner
Home Financials are based on the most recent Mortgage that was taken out on this home.
Original Mortgage
$95,600
Interest Rate
5.85%
Mortgage Type
Purchase Money Mortgage
Purchase Details
Closed on
Aug 4, 1999
Sold by
Pendell Verla L
Bought by
Loase Bradley J
Home Financials for this Owner
Home Financials are based on the most recent Mortgage that was taken out on this home.
Original Mortgage
$79,900
Interest Rate
6.75%
Create a Home Valuation Report for This Property
The Home Valuation Report is an in-depth analysis detailing your home's value as well as a comparison with similar homes in the area
Home Values in the Area
Average Home Value in this Area
Purchase History
| Date | Buyer | Sale Price | Title Company |
|---|---|---|---|
| Blosser Roberta L | $112,000 | Attorney | |
| Hobbs Travis J | $119,500 | -- | |
| Loase Bradley J | $99,900 | -- |
Source: Public Records
Mortgage History
| Date | Status | Borrower | Loan Amount |
|---|---|---|---|
| Open | Blosser Roberta L | $112,000 | |
| Previous Owner | Hobbs Travis J | $95,600 | |
| Previous Owner | Loase Bradley J | $79,900 |
Source: Public Records
Tax History Compared to Growth
Tax History
| Year | Tax Paid | Tax Assessment Tax Assessment Total Assessment is a certain percentage of the fair market value that is determined by local assessors to be the total taxable value of land and additions on the property. | Land | Improvement |
|---|---|---|---|---|
| 2024 | $3,098 | $54,290 | $9,900 | $44,390 |
| 2023 | $3,098 | $54,290 | $9,900 | $44,390 |
| 2022 | $2,831 | $38,170 | $6,970 | $31,200 |
| 2021 | $2,839 | $38,170 | $6,970 | $31,200 |
| 2020 | $2,786 | $38,170 | $6,970 | $31,200 |
| 2019 | $2,534 | $31,100 | $8,020 | $23,080 |
| 2018 | $2,488 | $31,100 | $8,020 | $23,080 |
| 2017 | $2,471 | $31,100 | $8,020 | $23,080 |
| 2016 | $2,400 | $29,670 | $6,970 | $22,700 |
| 2015 | $2,195 | $29,670 | $6,970 | $22,700 |
| 2014 | $2,195 | $29,670 | $6,970 | $22,700 |
| 2012 | -- | $32,510 | $7,730 | $24,780 |
Source: Public Records
Map
Nearby Homes
- 1010 Heathwood Dr
- 1017 Terracewood Dr
- 1008 Merrywood Dr
- 505 Durst Dr
- 510 Lambert Ln
- 229 Brookwood Dr
- 717 Woodlawn Ave
- 718 Bonnycastle Ave
- 174 Candle Ct Unit 12
- 178 Candle Ct Unit 14
- 117 Candle Ct Unit 740
- 510 Rohr Ln
- 4220 Pleasanton Rd
- 206 Gardengrove Way
- 4230 Pleasanton Rd
- 803 Albert St
- 534 Unger Ave
- 4161 Gorman Ave
- 4030 Gateway Dr
- 916 S Main St
- 1015 Hazel Ave
- 1011 Hazel Ave
- 1018 Heathwood Dr
- 1020 Heathwood Dr
- 1016 Heathwood Dr
- 1017 Hazel Ave
- 1012 Hazel Ave
- 1014 Heathwood Dr
- 1014 Hazel Ave
- 1009 Hazel Ave
- 1010 Hazel Ave
- 1022 Heathwood Dr
- 1016 Hazel Ave
- 1012 Heathwood Dr
- 1019 Hazel Ave
- 1008 Hazel Ave
- 1024 Heathwood Dr
- 1007 Hazel Ave
- 1019 Heathwood Dr
- 1009 Derringer Dr