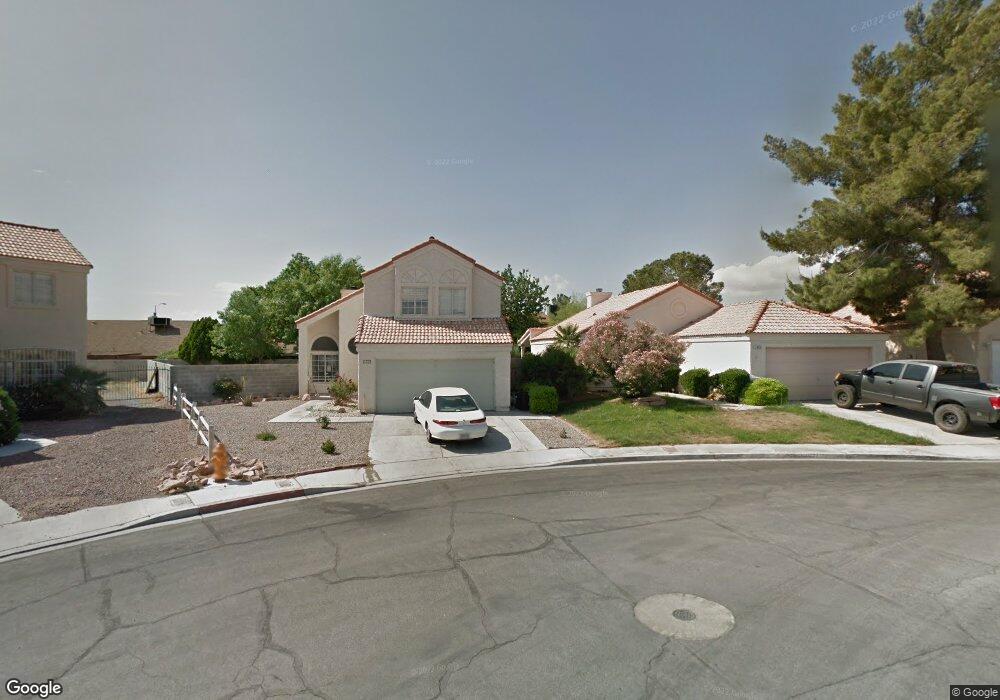
1013 Holliston Cir Las Vegas, NV 89108
Michael Way NeighborhoodEstimated Value: $361,634 - $387,000
3
Beds
3
Baths
1,368
Sq Ft
$271/Sq Ft
Est. Value
About This Home
This home is located at 1013 Holliston Cir, Las Vegas, NV 89108 and is currently estimated at $371,409, approximately $271 per square foot. 1013 Holliston Cir is a home located in Clark County with nearby schools including Paul E. Culley Elementary School, Frank F Garside Junior High School, and Western High School.
Ownership History
Date
Name
Owned For
Owner Type
Purchase Details
Closed on
Jan 18, 2011
Sold by
Rios Barbara and Perez Roberto R
Bought by
Nguyen Phach
Current Estimated Value
Purchase Details
Closed on
Sep 26, 2005
Sold by
Mojarro Amparo and Alvarez Michael
Bought by
Perez Roberto R and Rios Barbara
Home Financials for this Owner
Home Financials are based on the most recent Mortgage that was taken out on this home.
Original Mortgage
$205,600
Interest Rate
6.5%
Mortgage Type
Unknown
Purchase Details
Closed on
Jul 18, 2002
Sold by
Contreras Jose J and Contreras Sirley E
Bought by
Alvarez Michael and Mojarro Amparo
Home Financials for this Owner
Home Financials are based on the most recent Mortgage that was taken out on this home.
Original Mortgage
$140,790
Interest Rate
6.7%
Mortgage Type
FHA
Purchase Details
Closed on
Jul 22, 1999
Sold by
Marco Joseph M and Marco Patricia A
Bought by
Contreras Joan J and Contreras Sirley E
Home Financials for this Owner
Home Financials are based on the most recent Mortgage that was taken out on this home.
Original Mortgage
$118,233
Interest Rate
7.64%
Mortgage Type
FHA
Create a Home Valuation Report for This Property
The Home Valuation Report is an in-depth analysis detailing your home's value as well as a comparison with similar homes in the area
Home Values in the Area
Average Home Value in this Area
Purchase History
| Date | Buyer | Sale Price | Title Company |
|---|---|---|---|
| Nguyen Phach | $70,000 | None Available | |
| Perez Roberto R | $257,000 | Lawyers Title Of Nevada | |
| Alvarez Michael | $143,000 | Land Title | |
| Contreras Joan J | $119,000 | United Title |
Source: Public Records
Mortgage History
| Date | Status | Borrower | Loan Amount |
|---|---|---|---|
| Previous Owner | Perez Roberto R | $205,600 | |
| Previous Owner | Alvarez Michael | $140,790 | |
| Previous Owner | Contreras Joan J | $118,233 |
Source: Public Records
Tax History Compared to Growth
Tax History
| Year | Tax Paid | Tax Assessment Tax Assessment Total Assessment is a certain percentage of the fair market value that is determined by local assessors to be the total taxable value of land and additions on the property. | Land | Improvement |
|---|---|---|---|---|
| 2025 | $1,160 | $65,854 | $28,350 | $37,504 |
| 2024 | $1,126 | $65,854 | $28,350 | $37,504 |
| 2023 | $1,181 | $64,184 | $28,000 | $36,184 |
| 2022 | $1,147 | $55,738 | $22,400 | $33,338 |
| 2021 | $1,062 | $53,007 | $21,000 | $32,007 |
| 2020 | $1,065 | $51,936 | $19,950 | $31,986 |
| 2019 | $1,016 | $48,185 | $16,450 | $31,735 |
| 2018 | $969 | $44,977 | $14,350 | $30,627 |
| 2017 | $1,449 | $44,191 | $12,950 | $31,241 |
| 2016 | $919 | $42,148 | $10,500 | $31,648 |
| 2015 | $918 | $32,643 | $5,950 | $26,693 |
| 2014 | $889 | $26,315 | $4,900 | $21,415 |
Source: Public Records
Map
Nearby Homes
- 6325 W Washington Ave
- 1209 Coral Isle Way
- 6229 Saginaw Dr
- 6532 Moon Roses Ct
- 6205 Carmen Blvd
- 814 Pepperwood Ln
- 812 Pepperwood Ln
- 6224 Fargo Ave
- 6521 Sugarpine Ln
- 6244 Rassler Ave
- 6261 Rassler Ave
- 6509 Brushwood Ln
- 513 Buttonwood Ln
- 304 N Torrey Pines Dr
- 6224 Mandarin Dr
- 704 N Wallace Dr
- 6380 Mint Frost Way
- 6208 Mandarin Dr
- 6505 Hill View Ave
- 801 Purcell Dr
- 1009 Holliston Cir
- 1017 Holliston Cir
- 6360 Copperfield Ave
- 1005 Holliston Cir
- 6368 Copperfield Ave
- 1021 Holliston Cir
- 6356 Copperfield Ave
- 6372 Copperfield Ave
- 6352 Copperfield Ave
- 1025 Holliston Cir
- 1001 Holliston Cir
- 1004 Aspen Hill Cir
- 1016 Holliston Cir
- 1000 Aspen Hill Cir
- 6376 Copperfield Ave
- 6348 Copperfield Ave
- 1012 Holliston Cir
- 1008 Aspen Hill Cir
- 1029 Holliston Cir