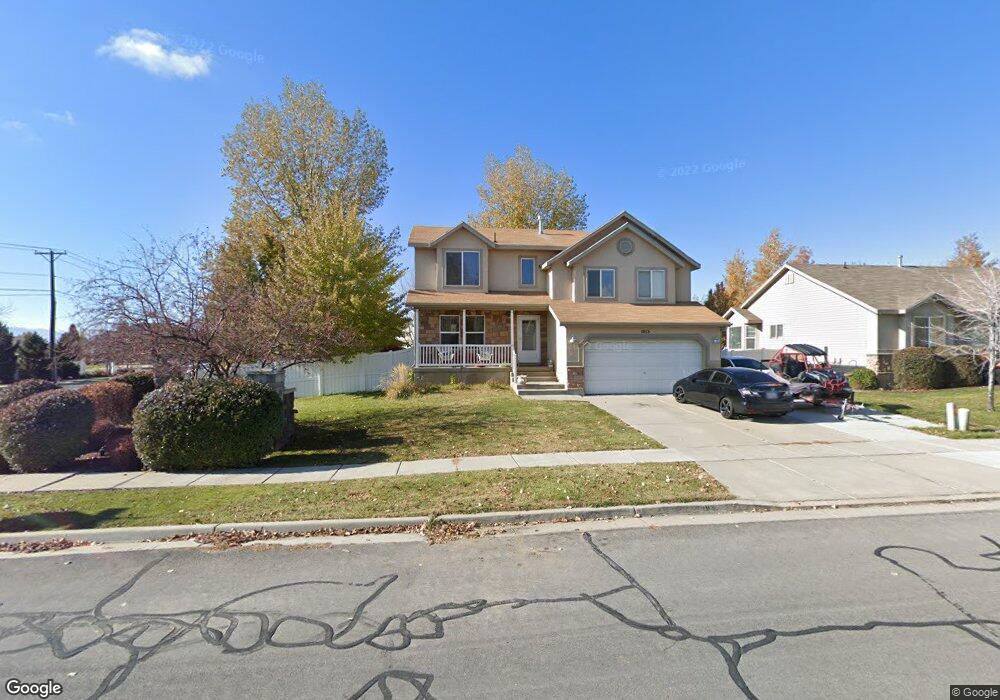
1013 N 3450 W Layton, UT 84041
Estimated Value: $525,645 - $575,000
4
Beds
2
Baths
2,311
Sq Ft
$236/Sq Ft
Est. Value
About This Home
This home is located at 1013 N 3450 W, Layton, UT 84041 and is currently estimated at $546,161, approximately $236 per square foot. 1013 N 3450 W is a home located in Davis County with nearby schools including Sand Springs Elementary School, Legacy Junior High School, and Layton High School.
Ownership History
Date
Name
Owned For
Owner Type
Purchase Details
Closed on
Nov 21, 2024
Sold by
Ornelas Alejandro Delgado
Bought by
Castillo Jose Angel Perez
Current Estimated Value
Purchase Details
Closed on
Nov 9, 2020
Sold by
Prescott Matthew W and Prescott Jennifer E
Bought by
Onclas Alejandro Delgado
Home Financials for this Owner
Home Financials are based on the most recent Mortgage that was taken out on this home.
Original Mortgage
$360,000
Interest Rate
2.8%
Mortgage Type
New Conventional
Purchase Details
Closed on
Oct 30, 2003
Sold by
Gmw Development Inc
Bought by
Sanchez Ramon and Sanchez Carol A
Home Financials for this Owner
Home Financials are based on the most recent Mortgage that was taken out on this home.
Original Mortgage
$174,309
Interest Rate
5.98%
Mortgage Type
VA
Create a Home Valuation Report for This Property
The Home Valuation Report is an in-depth analysis detailing your home's value as well as a comparison with similar homes in the area
Home Values in the Area
Average Home Value in this Area
Purchase History
| Date | Buyer | Sale Price | Title Company |
|---|---|---|---|
| Castillo Jose Angel Perez | -- | None Listed On Document | |
| Castillo Jose Angel Perez | -- | None Listed On Document | |
| Onclas Alejandro Delgado | -- | Investors Title Ins Ag | |
| Sanchez Ramon | -- | Bonneville Title Company Inc |
Source: Public Records
Mortgage History
| Date | Status | Borrower | Loan Amount |
|---|---|---|---|
| Previous Owner | Onclas Alejandro Delgado | $360,000 | |
| Previous Owner | Sanchez Ramon | $174,309 |
Source: Public Records
Tax History Compared to Growth
Tax History
| Year | Tax Paid | Tax Assessment Tax Assessment Total Assessment is a certain percentage of the fair market value that is determined by local assessors to be the total taxable value of land and additions on the property. | Land | Improvement |
|---|---|---|---|---|
| 2025 | $2,552 | $267,850 | $110,857 | $156,993 |
| 2024 | $2,497 | $264,000 | $121,465 | $142,535 |
| 2023 | $2,398 | $447,000 | $122,531 | $324,469 |
| 2022 | $2,614 | $264,550 | $75,050 | $189,500 |
| 2021 | $2,372 | $358,000 | $112,589 | $245,411 |
| 2020 | $2,127 | $308,000 | $95,129 | $212,871 |
| 2019 | $2,094 | $297,000 | $96,702 | $200,298 |
| 2018 | $1,896 | $270,000 | $84,915 | $185,085 |
| 2016 | $1,652 | $121,330 | $33,821 | $87,509 |
| 2015 | $1,641 | $114,455 | $33,821 | $80,634 |
| 2014 | $1,643 | $117,116 | $33,821 | $83,295 |
| 2013 | $1,576 | $106,378 | $28,952 | $77,426 |
Source: Public Records
Map
Nearby Homes