Estimated Value: $144,000 - $1,695,000
3
Beds
1
Bath
1,348
Sq Ft
$398/Sq Ft
Est. Value
About This Home
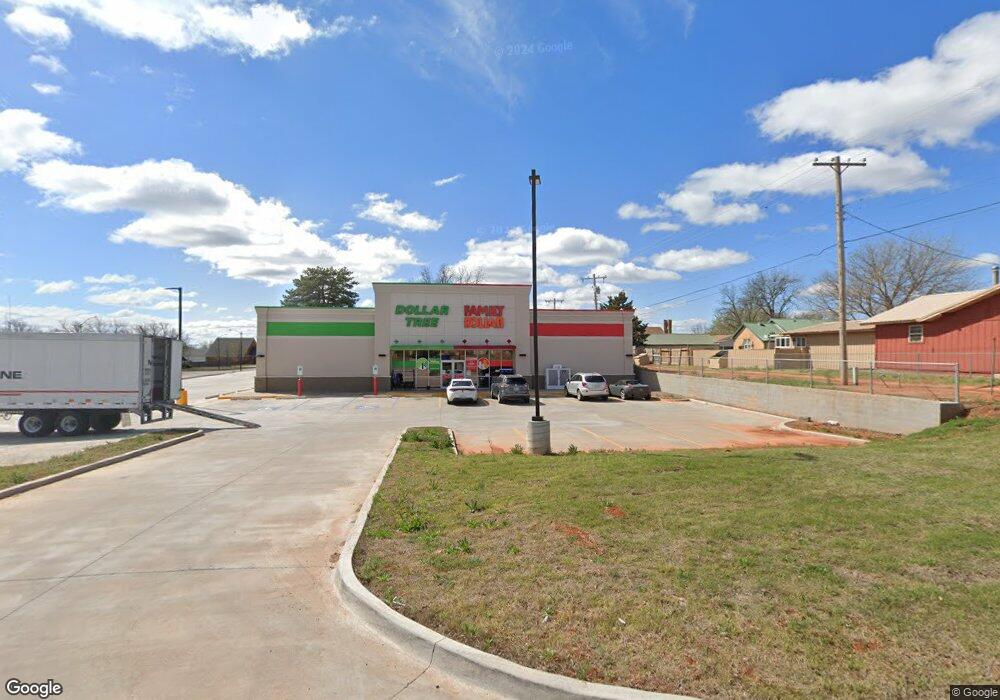
This home is located at 1013 N 4th St, Sayre, OK 73662 and is currently estimated at $536,334, approximately $397 per square foot. 1013 N 4th St is a home located in Beckham County with nearby schools including Sayre Elementary School, Sayre Middle School, and Sayre High School.
Ownership History
Date
Name
Owned For
Owner Type
Purchase Details
Closed on
Aug 15, 2023
Sold by
Colbcar Llc
Bought by
Realty Income Properties 29 Llc
Current Estimated Value
Purchase Details
Closed on
Aug 31, 2022
Sold by
Sayre Industrial Authority
Bought by
Colbcar Llc
Home Financials for this Owner
Home Financials are based on the most recent Mortgage that was taken out on this home.
Original Mortgage
$387,517
Interest Rate
4.99%
Mortgage Type
Construction
Purchase Details
Closed on
Oct 16, 2001
Sold by
Cohen
Bought by
Riggs
Purchase Details
Closed on
Mar 24, 1993
Sold by
Hundley
Bought by
Cohen
Create a Home Valuation Report for This Property
The Home Valuation Report is an in-depth analysis detailing your home's value as well as a comparison with similar homes in the area
Home Values in the Area
Average Home Value in this Area
Purchase History
| Date | Buyer | Sale Price | Title Company |
|---|---|---|---|
| Realty Income Properties 29 Llc | $1,856,500 | None Listed On Document | |
| Realty Income Prop 29 Llc | $1,856,500 | None Listed On Document | |
| Colbcar Llc | -- | Stewart Title Of Oklahoma | |
| Riggs | -- | -- | |
| Cohen | $17,000 | -- |
Source: Public Records
Mortgage History
| Date | Status | Borrower | Loan Amount |
|---|---|---|---|
| Previous Owner | Colbcar Llc | $387,517 |
Source: Public Records
Tax History Compared to Growth
Tax History
| Year | Tax Paid | Tax Assessment Tax Assessment Total Assessment is a certain percentage of the fair market value that is determined by local assessors to be the total taxable value of land and additions on the property. | Land | Improvement |
|---|---|---|---|---|
| 2025 | $1,329 | $112,832 | $4,420 | $108,412 |
| 2024 | $1,329 | $16,346 | $577 | $15,769 |
| 2023 | $1,330 | $16,346 | $577 | $15,769 |
| 2022 | $44 | $540 | $540 | $0 |
| 2021 | $0 | $0 | $0 | $0 |
| 2020 | $113 | $0 | $0 | $0 |
| 2019 | $113 | $0 | $0 | $0 |
| 2018 | $114 | $2,341 | $734 | $1,607 |
| 2017 | $109 | $2,273 | $734 | $1,539 |
| 2016 | $103 | $2,207 | $734 | $1,473 |
| 2015 | $89 | $2,143 | $734 | $1,409 |
| 2014 | $82 | $2,080 | $734 | $1,346 |
Source: Public Records
Map
Nearby Homes