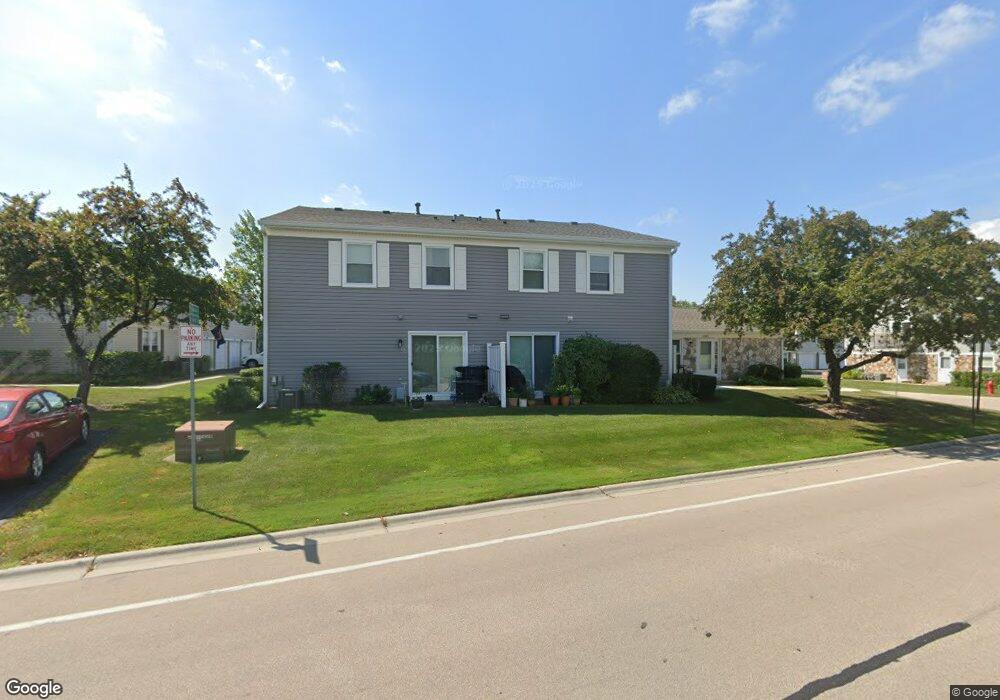
1013 Newport Harbor Unit 6703 Schaumburg, IL 60193
South Schaumburg NeighborhoodEstimated Value: $252,795 - $282,000
2
Beds
2
Baths
975
Sq Ft
$271/Sq Ft
Est. Value
About This Home
This home is located at 1013 Newport Harbor Unit 6703, Schaumburg, IL 60193 and is currently estimated at $263,949, approximately $270 per square foot. 1013 Newport Harbor Unit 6703 is a home located in Cook County with nearby schools including Michael Collins Elementary School, Robert Frost Junior High School, and J B Conant High School.
Ownership History
Date
Name
Owned For
Owner Type
Purchase Details
Closed on
Dec 13, 2023
Sold by
Buchacz Monika B and Marcin Slawomir
Bought by
Buchacz Properties Llc
Current Estimated Value
Purchase Details
Closed on
Jun 20, 2017
Sold by
Buchacz Monika and Manik Marcia S
Bought by
Buchacz Monika and Munik Marcin S
Home Financials for this Owner
Home Financials are based on the most recent Mortgage that was taken out on this home.
Original Mortgage
$123,750
Interest Rate
4.12%
Mortgage Type
New Conventional
Purchase Details
Closed on
Jul 29, 2016
Sold by
Vargas Nelson L
Bought by
Buchacz Monika
Purchase Details
Closed on
Aug 26, 1998
Sold by
Stahly Lisa M
Bought by
Vargas Nelson L and Vargas Carmen
Home Financials for this Owner
Home Financials are based on the most recent Mortgage that was taken out on this home.
Original Mortgage
$89,750
Interest Rate
7.02%
Mortgage Type
FHA
Create a Home Valuation Report for This Property
The Home Valuation Report is an in-depth analysis detailing your home's value as well as a comparison with similar homes in the area
Home Values in the Area
Average Home Value in this Area
Purchase History
| Date | Buyer | Sale Price | Title Company |
|---|---|---|---|
| Buchacz Properties Llc | -- | None Listed On Document | |
| Buchacz Monika | -- | Chicago Title Insurance Comp | |
| Buchacz Monika | $105,000 | None Available | |
| Vargas Nelson L | $96,500 | -- |
Source: Public Records
Mortgage History
| Date | Status | Borrower | Loan Amount |
|---|---|---|---|
| Previous Owner | Buchacz Monika | $123,750 | |
| Previous Owner | Vargas Nelson L | $89,750 |
Source: Public Records
Tax History Compared to Growth
Tax History
| Year | Tax Paid | Tax Assessment Tax Assessment Total Assessment is a certain percentage of the fair market value that is determined by local assessors to be the total taxable value of land and additions on the property. | Land | Improvement |
|---|---|---|---|---|
| 2024 | $4,367 | $15,590 | $646 | $14,944 |
| 2023 | $3,306 | $15,590 | $646 | $14,944 |
| 2022 | $3,306 | $15,590 | $646 | $14,944 |
| 2021 | $3,196 | $13,874 | $352 | $13,522 |
| 2020 | $3,209 | $13,874 | $352 | $13,522 |
| 2019 | $3,213 | $15,416 | $352 | $15,064 |
| 2018 | $2,253 | $10,944 | $293 | $10,651 |
| 2017 | $2,236 | $10,944 | $293 | $10,651 |
| 2016 | $3,023 | $10,944 | $293 | $10,651 |
| 2015 | $2,794 | $9,341 | $264 | $9,077 |
| 2014 | $2,764 | $9,341 | $264 | $9,077 |
| 2013 | $852 | $9,341 | $264 | $9,077 |
Source: Public Records
Map
Nearby Homes
- 1078 Newport Harbor Unit 6101
- 1100 Boston Harbor Unit 7004
- 286 Nantucket Harbor Unit 601
- 421 E Wise Rd
- 1205 Laurel Ln
- 731 Highpoint Ct
- 620 S Point Dr
- 1323 S Roselle Rd
- 1420 Indian Hill Dr
- 717 Tipperary Ct Unit 1C
- 13 W Monterey Ave
- 826 Thornton Ct Unit 2AL
- 733 Limerick Ln Unit 7333D
- 712 Tipperary Ct Unit 1C
- 711 Tipperary Ct Unit 2D
- 517 E Weathersfield Way
- 722 Merlin Dr Unit 16
- 727 Killarney Ct Unit 2D
- 409 New York Ln
- 211 Steeple Bush Ln Unit 10343
- 1017 Newport Harbor Unit 6604
- 1009 Newport Harbor Unit 6701
- 1009 Newport Harbor Unit 1009
- 1011 Newport Harbor Unit 6702
- 1029 Newport Harbor Unit 6501
- 1031 Newport Harbor Unit 6502
- 1014 Newport Harbor Unit 5604
- 1012 Newport Harbor Unit 5603
- 1021 Newport Harbor Unit 6602
- 1016 Newport Harbor Unit 5601
- 1023 Newport Harbor Unit 6603
- 1018 Newport Harbor Unit 5602
- 1025 Newport Harbor Unit 6503
- 1032 Newport Harbor Unit 5702
- 1044 Newport Harbor Unit 5801
- 1030 Newport Harbor Unit 1030
- 1033 Newport Harbor Unit 6404
- 1034 Newport Harbor Unit 5703
- 1039 Newport Harbor Unit 6401
- 1028 Newport Harbor Unit 5704