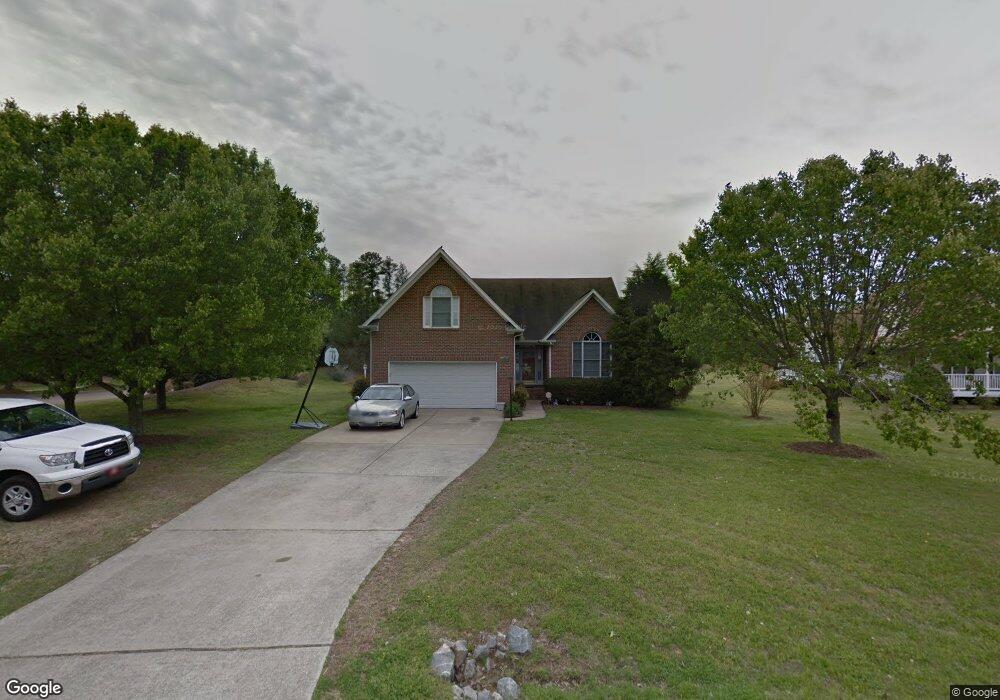
1013 Red Brick Rd Garner, NC 27529
Estimated Value: $420,971 - $495,000
3
Beds
2
Baths
2,011
Sq Ft
$225/Sq Ft
Est. Value
About This Home
This home is located at 1013 Red Brick Rd, Garner, NC 27529 and is currently estimated at $453,243, approximately $225 per square foot. 1013 Red Brick Rd is a home located in Wake County with nearby schools including Aversboro Elementary, East Garner Middle School, and South Garner High.
Ownership History
Date
Name
Owned For
Owner Type
Purchase Details
Closed on
Mar 12, 2007
Sold by
Duncan William M and Duncan Geraldine M
Bought by
Harley Joseph R and Harley Patricia
Current Estimated Value
Home Financials for this Owner
Home Financials are based on the most recent Mortgage that was taken out on this home.
Original Mortgage
$186,400
Outstanding Balance
$112,392
Interest Rate
6.19%
Mortgage Type
Purchase Money Mortgage
Estimated Equity
$340,851
Purchase Details
Closed on
May 30, 2006
Sold by
Hsbc Bank Usa
Bought by
Duncan William M and Duncan Geraldine M
Home Financials for this Owner
Home Financials are based on the most recent Mortgage that was taken out on this home.
Original Mortgage
$44,750
Interest Rate
6.12%
Mortgage Type
Stand Alone Second
Purchase Details
Closed on
Mar 30, 2001
Sold by
Hovey H Daniel and Hovey Louise W
Bought by
Butcher Robert L and Butcher Anita L
Create a Home Valuation Report for This Property
The Home Valuation Report is an in-depth analysis detailing your home's value as well as a comparison with similar homes in the area
Home Values in the Area
Average Home Value in this Area
Purchase History
| Date | Buyer | Sale Price | Title Company |
|---|---|---|---|
| Harley Joseph R | $233,000 | None Available | |
| Duncan William M | $179,000 | None Available | |
| Butcher Robert L | $177,000 | Fidelity National Title Co |
Source: Public Records
Mortgage History
| Date | Status | Borrower | Loan Amount |
|---|---|---|---|
| Open | Harley Joseph R | $186,400 | |
| Previous Owner | Duncan William M | $44,750 | |
| Previous Owner | Duncan William M | $125,300 |
Source: Public Records
Tax History Compared to Growth
Tax History
| Year | Tax Paid | Tax Assessment Tax Assessment Total Assessment is a certain percentage of the fair market value that is determined by local assessors to be the total taxable value of land and additions on the property. | Land | Improvement |
|---|---|---|---|---|
| 2025 | $2,453 | $380,327 | $90,000 | $290,327 |
| 2024 | $2,382 | $380,327 | $90,000 | $290,327 |
| 2023 | $1,891 | $239,998 | $42,000 | $197,998 |
| 2022 | $1,753 | $239,998 | $42,000 | $197,998 |
| 2021 | $1,706 | $239,998 | $42,000 | $197,998 |
| 2020 | $1,678 | $239,998 | $42,000 | $197,998 |
| 2019 | $1,655 | $200,162 | $35,000 | $165,162 |
| 2018 | $1,522 | $200,162 | $35,000 | $165,162 |
| 2017 | $1,443 | $200,162 | $35,000 | $165,162 |
| 2016 | $1,414 | $200,162 | $35,000 | $165,162 |
| 2015 | $1,568 | $222,934 | $40,000 | $182,934 |
| 2014 | $1,487 | $222,934 | $40,000 | $182,934 |
Source: Public Records
Map
Nearby Homes
- 1004 Cabin Hill Way
- 9017 Hunterfox Ct
- 9505 Neils Branch Rd
- 5521 Fantasy Moth Dr
- 107 Bull Bay Ln
- 139 Bull Bay Ln
- 948 Grand Mesa Dr
- 940 Grand Mesa Dr
- 944 Grand Mesa Dr
- 936 Grand Mesa Dr
- 932 Grand Mesa Dr
- 928 Grand Mesa Dr
- 135 Bull Bay Ln
- 10001 Joe Leach Rd
- 221 Sprenger St
- 229 Sprenger St
- 233 Sprenger St
- 941 Grand Mesa Dr
- 937 Grand Mesa Dr
- 933 Grand Mesa Dr
- 1017 Red Brick Rd
- 1016 Red Brick Rd
- 1021 Red Brick Rd
- 1009 Red Brick Rd
- 1008 Red Brick Rd
- 1024 Red Brick Rd
- 1001 Red Brick Rd
- 1025 Red Brick Rd
- 1017 Southern Trace Trail
- 1004 Red Brick Rd
- 1000 Red Brick Rd
- 1021 Southern Trace Trail
- 1036 Red Brick Rd
- 1029 Red Brick Rd
- 1033 Red Brick Rd
- 3412 Benson Rd
- 1029 Spanish Moss Ln
- 1025 Southern Trace Trail
- 5108 Cotton Boll Ct
- 1037 Red Brick Rd