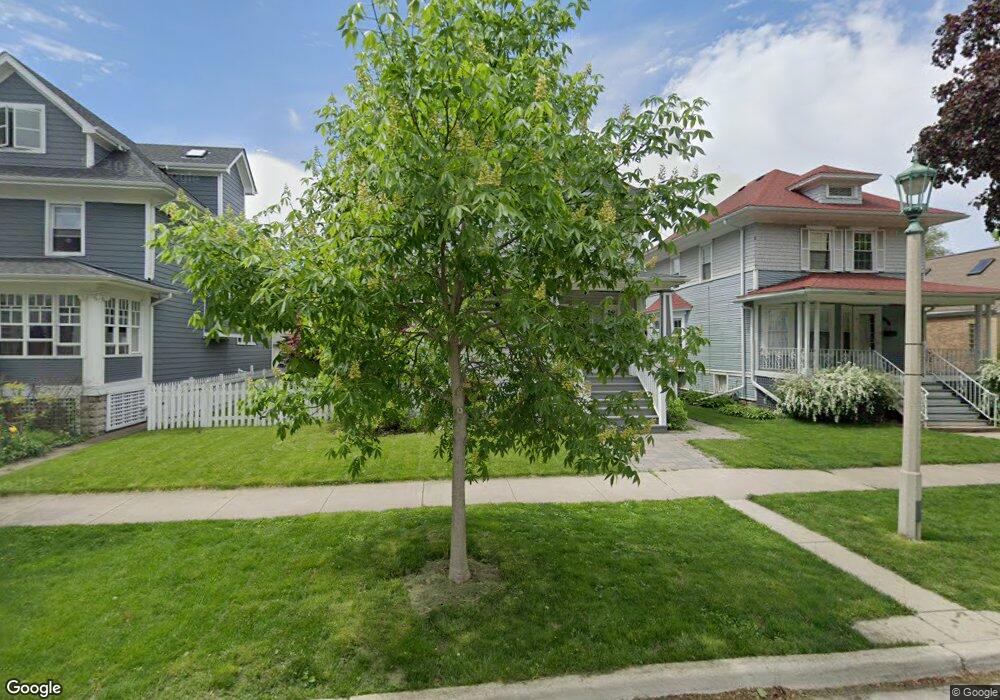
1013 S Euclid Ave Oak Park, IL 60304
Estimated Value: $704,000 - $939,000
5
Beds
4
Baths
2,602
Sq Ft
$301/Sq Ft
Est. Value
About This Home
This home is located at 1013 S Euclid Ave, Oak Park, IL 60304 and is currently estimated at $783,116, approximately $300 per square foot. 1013 S Euclid Ave is a home located in Cook County with nearby schools including Abraham Lincoln Elementary School, Gwendolyn Brooks Middle School, and Oak Park and River Forest High School.
Ownership History
Date
Name
Owned For
Owner Type
Purchase Details
Closed on
Mar 3, 2017
Sold by
Hershberger Richard and Blumetti Jennifer
Bought by
Alvey Graham and Alvey Nicole
Current Estimated Value
Home Financials for this Owner
Home Financials are based on the most recent Mortgage that was taken out on this home.
Original Mortgage
$415,500
Outstanding Balance
$341,644
Interest Rate
3.87%
Mortgage Type
New Conventional
Estimated Equity
$441,472
Purchase Details
Closed on
Apr 2, 2010
Sold by
Pych Daniel J and Pych Kyra L
Bought by
Hershberger Richard and Blumetti Jennifer
Home Financials for this Owner
Home Financials are based on the most recent Mortgage that was taken out on this home.
Original Mortgage
$91,000
Interest Rate
5.03%
Mortgage Type
Stand Alone Second
Purchase Details
Closed on
Nov 28, 2008
Sold by
Cummings Lee Ann and Gielow Herbert F
Bought by
Cummings Michael R and Cummings Lee Ann
Create a Home Valuation Report for This Property
The Home Valuation Report is an in-depth analysis detailing your home's value as well as a comparison with similar homes in the area
Home Values in the Area
Average Home Value in this Area
Purchase History
| Date | Buyer | Sale Price | Title Company |
|---|---|---|---|
| Alvey Graham | $692,500 | Baird & Warner Title Service | |
| Hershberger Richard | $635,000 | First American Title Ins Co | |
| Pych Daniel J | $250,000 | First American Title | |
| Cummings Michael R | -- | Stewart Title Company |
Source: Public Records
Mortgage History
| Date | Status | Borrower | Loan Amount |
|---|---|---|---|
| Open | Alvey Graham | $415,500 | |
| Previous Owner | Pych Daniel J | $91,000 | |
| Previous Owner | Hershberger Richard | $417,000 |
Source: Public Records
Tax History Compared to Growth
Tax History
| Year | Tax Paid | Tax Assessment Tax Assessment Total Assessment is a certain percentage of the fair market value that is determined by local assessors to be the total taxable value of land and additions on the property. | Land | Improvement |
|---|---|---|---|---|
| 2024 | $18,158 | $54,315 | $4,270 | $50,045 |
| 2023 | $14,475 | $58,684 | $4,270 | $54,414 |
| 2022 | $14,475 | $40,776 | $3,203 | $37,573 |
| 2021 | $14,136 | $40,774 | $3,202 | $37,572 |
| 2020 | $13,865 | $40,774 | $3,202 | $37,572 |
| 2019 | $17,330 | $48,257 | $2,897 | $45,360 |
| 2018 | $17,820 | $48,257 | $2,897 | $45,360 |
| 2017 | $16,332 | $48,257 | $2,897 | $45,360 |
| 2016 | $14,478 | $38,219 | $2,440 | $35,779 |
| 2015 | $12,931 | $38,219 | $2,440 | $35,779 |
| 2014 | $12,033 | $38,219 | $2,440 | $35,779 |
| 2013 | $10,702 | $35,252 | $2,440 | $32,812 |
Source: Public Records
Map
Nearby Homes
- 1101 S Oak Park Ave
- 915 S Oak Park Ave Unit 1-B
- 924 Wesley Ave Unit 2
- 920 Wesley Ave Unit 1
- 1135 S Oak Park Ave
- 644 Harrison St Unit 1
- 808 S Euclid Ave
- 1156 Wesley Ave
- 642 Van Buren St Unit 2
- 1143 Clinton Ave
- 737 Clarence Ave
- 1125 Gunderson Ave
- 723 Wesley Ave
- 721 Clarence Ave
- 706 S Oak Park Ave
- 1183 S Scoville Ave
- 1133 S Ridgeland Ave
- 620 S Grove Ave
- 7011 Roosevelt Rd
- 1223 S Elmwood Ave Unit TWO
- 1013 S Euclid Ave
- 1011 S Euclid Ave
- 1017 S Euclid Ave
- 1007 S Euclid Ave
- 1021 S Euclid Ave
- 1005 S Euclid Ave
- 1025 S Euclid Ave
- 1001 S Euclid Ave
- 1010 S Oak Park Ave
- 1018 S Oak Park Ave
- 1014 S Oak Park Ave Unit 1
- 1006 S Oak Park Ave
- 1020 S Oak Park Ave
- 1029 S Euclid Ave
- 1012 S Euclid Ave
- 1014 S Euclid Ave
- 1010 S Euclid Ave
- 1018 S Euclid Ave
- 1020 S Euclid Ave
- 1006 S Euclid Ave