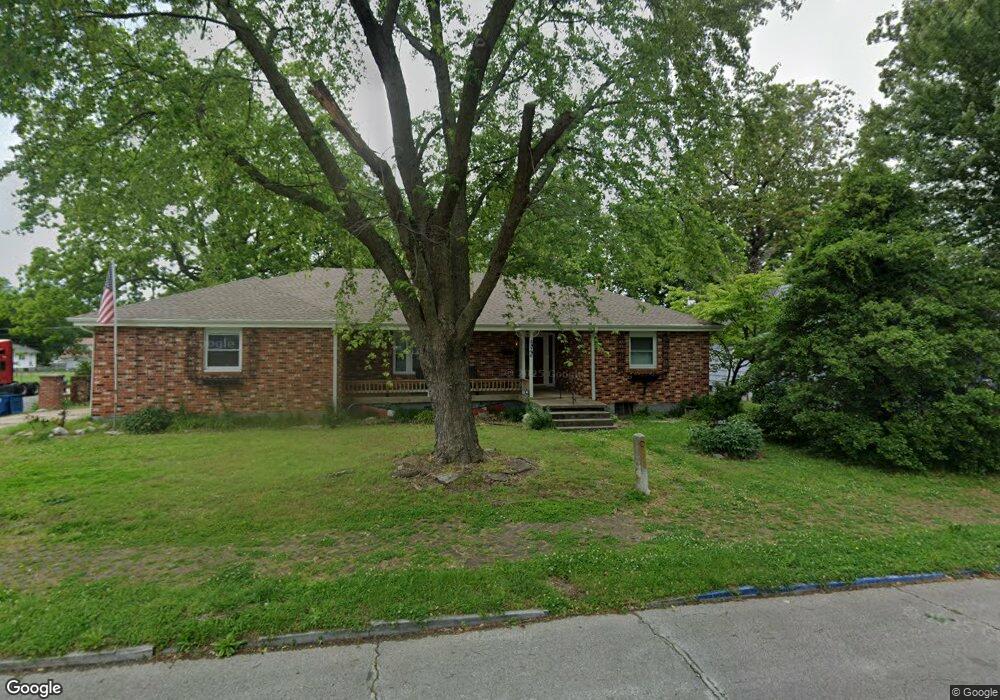
1013 S Main St Carthage, MO 64836
Estimated Value: $200,000 - $292,000
3
Beds
3
Baths
2,450
Sq Ft
$106/Sq Ft
Est. Value
About This Home
This home is located at 1013 S Main St, Carthage, MO 64836 and is currently estimated at $260,206, approximately $106 per square foot. 1013 S Main St is a home located in Jasper County with nearby schools including Carthage High School, St. Ann's Catholic School, and Victory Academy.
Ownership History
Date
Name
Owned For
Owner Type
Purchase Details
Closed on
Jun 6, 2022
Sold by
Neal Herron William
Bought by
Layne Brian W and Layne Leigha M
Current Estimated Value
Home Financials for this Owner
Home Financials are based on the most recent Mortgage that was taken out on this home.
Original Mortgage
$178,600
Outstanding Balance
$169,421
Interest Rate
5.09%
Mortgage Type
New Conventional
Estimated Equity
$90,785
Purchase Details
Closed on
Nov 23, 2020
Sold by
Edington Joshua E and Eddington Mylinn R
Bought by
Herron William N
Purchase Details
Closed on
Aug 29, 2011
Sold by
Vangilder Dorothy Mildred
Bought by
Knight Mary A
Home Financials for this Owner
Home Financials are based on the most recent Mortgage that was taken out on this home.
Original Mortgage
$121,343
Interest Rate
4.53%
Mortgage Type
FHA
Create a Home Valuation Report for This Property
The Home Valuation Report is an in-depth analysis detailing your home's value as well as a comparison with similar homes in the area
Home Values in the Area
Average Home Value in this Area
Purchase History
| Date | Buyer | Sale Price | Title Company |
|---|---|---|---|
| Layne Brian W | -- | None Listed On Document | |
| Herron William N | -- | None Available | |
| Knight Mary A | -- | Abbey |
Source: Public Records
Mortgage History
| Date | Status | Borrower | Loan Amount |
|---|---|---|---|
| Open | Layne Brian W | $178,600 | |
| Previous Owner | Knight Mary A | $121,343 |
Source: Public Records
Tax History Compared to Growth
Tax History
| Year | Tax Paid | Tax Assessment Tax Assessment Total Assessment is a certain percentage of the fair market value that is determined by local assessors to be the total taxable value of land and additions on the property. | Land | Improvement |
|---|---|---|---|---|
| 2025 | $1,483 | $32,840 | $1,360 | $31,480 |
| 2024 | $1,484 | $28,820 | $1,360 | $27,460 |
| 2023 | $1,484 | $28,820 | $1,360 | $27,460 |
| 2022 | $1,044 | $20,350 | $1,360 | $18,990 |
| 2021 | $1,033 | $20,350 | $1,360 | $18,990 |
| 2020 | $989 | $18,670 | $1,360 | $17,310 |
| 2019 | $990 | $18,670 | $1,360 | $17,310 |
| 2018 | $1,019 | $19,250 | $0 | $0 |
| 2017 | $1,021 | $19,250 | $0 | $0 |
| 2016 | $999 | $18,900 | $0 | $0 |
| 2015 | $924 | $18,900 | $0 | $0 |
| 2014 | $924 | $18,900 | $0 | $0 |
Source: Public Records
Map
Nearby Homes