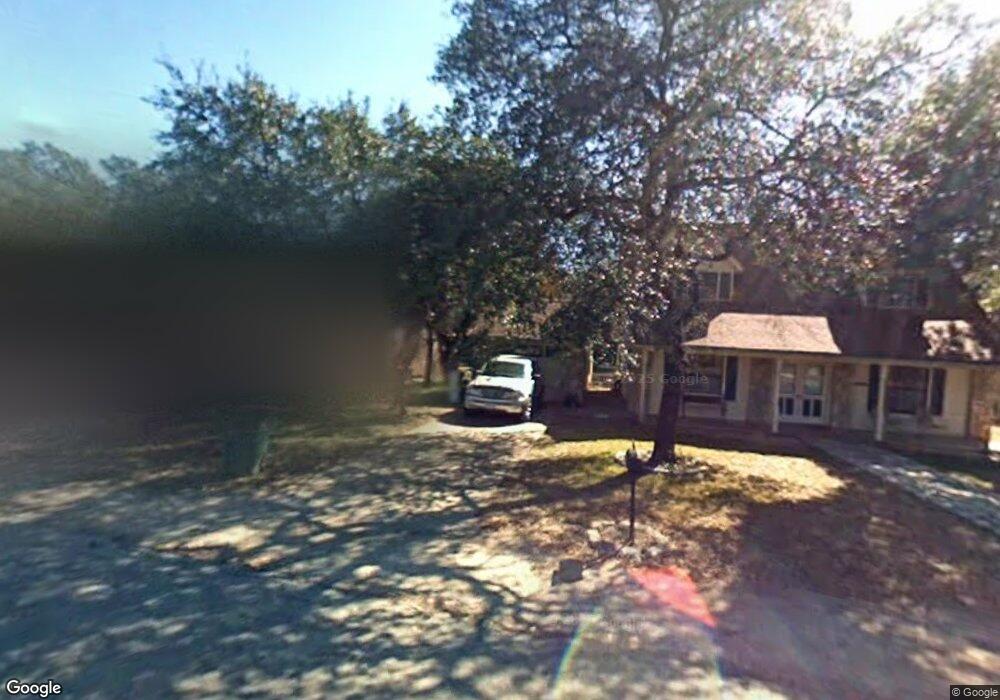
1013 Sierra Vista Dr Granbury, TX 76048
Estimated Value: $253,971 - $293,000
3
Beds
2
Baths
1,496
Sq Ft
$179/Sq Ft
Est. Value
About This Home
This home is located at 1013 Sierra Vista Dr, Granbury, TX 76048 and is currently estimated at $268,493, approximately $179 per square foot. 1013 Sierra Vista Dr is a home located in Hood County with nearby schools including Brawner Elementary School, Granbury Middle School, and Granbury High School.
Ownership History
Date
Name
Owned For
Owner Type
Purchase Details
Closed on
Aug 24, 2011
Sold by
Montez Larry and Montez Irene
Bought by
Hensley Linda J and Hensley Donnie E
Current Estimated Value
Home Financials for this Owner
Home Financials are based on the most recent Mortgage that was taken out on this home.
Original Mortgage
$88,000
Outstanding Balance
$60,845
Interest Rate
4.54%
Mortgage Type
New Conventional
Estimated Equity
$207,648
Purchase Details
Closed on
Aug 22, 2011
Sold by
Brockman Melinda Gail and Montez Melinda Gail
Bought by
Montez Larry
Home Financials for this Owner
Home Financials are based on the most recent Mortgage that was taken out on this home.
Original Mortgage
$88,000
Outstanding Balance
$60,845
Interest Rate
4.54%
Mortgage Type
New Conventional
Estimated Equity
$207,648
Purchase Details
Closed on
Oct 2, 1989
Bought by
Hensley Linda J Etvir Donnie E
Create a Home Valuation Report for This Property
The Home Valuation Report is an in-depth analysis detailing your home's value as well as a comparison with similar homes in the area
Home Values in the Area
Average Home Value in this Area
Purchase History
| Date | Buyer | Sale Price | Title Company |
|---|---|---|---|
| Hensley Linda J | -- | Central Texas Title | |
| Montez Larry | -- | Central Texas Title | |
| Hensley Linda J Etvir Donnie E | -- | -- |
Source: Public Records
Mortgage History
| Date | Status | Borrower | Loan Amount |
|---|---|---|---|
| Open | Hensley Linda J | $88,000 |
Source: Public Records
Tax History Compared to Growth
Tax History
| Year | Tax Paid | Tax Assessment Tax Assessment Total Assessment is a certain percentage of the fair market value that is determined by local assessors to be the total taxable value of land and additions on the property. | Land | Improvement |
|---|---|---|---|---|
| 2025 | $334 | $209,245 | $40,000 | $178,300 |
| 2024 | $334 | $190,223 | $40,000 | $190,470 |
| 2023 | $2,104 | $212,830 | $40,000 | $172,830 |
| 2022 | $1,039 | $174,240 | $20,000 | $154,240 |
| 2021 | $2,194 | $151,800 | $15,000 | $136,800 |
| 2020 | $2,018 | $143,900 | $10,000 | $133,900 |
| 2019 | $1,920 | $138,310 | $10,000 | $128,310 |
| 2018 | $1,746 | $107,380 | $10,000 | $97,380 |
| 2017 | $1,738 | $103,950 | $10,000 | $93,950 |
| 2016 | $1,659 | $99,180 | $10,000 | $89,180 |
| 2015 | $1,165 | $95,700 | $10,000 | $85,700 |
| 2014 | $1,165 | $95,700 | $10,000 | $85,700 |
Source: Public Records
Map
Nearby Homes
- 1104 Sierra Vista Dr
- 1206 Sierra Vista Dr
- 904 Spanish Trail Dr
- 1007 Laguna Vista Ct
- 2406 Camper Ct
- 508 Crestwood Dr
- 706 Hedgerow Trail
- 2509 White Oak Trail
- 323 Heritage Trail
- 2612 Orion Way
- 1519 Hayloft Ln
- 2518 Elk Trail
- 2417 Elk Trail
- 2408 Cedar Crest Dr
- 2520 Elk Trail
- 2151 S Morgan St
- 1031 Corral Dr
- 900 Tree Dr
- 2702 Brazos River Dr
- 2704 Brazos River Dr
- 1101 Sierra Vista Dr
- 1011 Sierra Vista Dr
- 1103 Sierra Vista Dr
- 1009 Sierra Vista Dr
- 1014 Sierra Vista Dr
- 1012 Sierra Vista Dr
- 1105 Sierra Vista Dr
- 1010 Sierra Vista Dr
- 1008 Sierra Vista Dr
- 1100 Sierra Vista Dr
- 1107 Sierra Vista Dr
- 1105 Caballo Way
- 1107 Caballo Way
- 1103 Caballo Way
- 2010 Boca Vista Dr
- 1109 Caballo Way
- 1110 Spanish Trail Dr
- 1108 Spanish Trail Dr
- 1108 Sierra Vista Dr
- 1104 Spanish Trail Dr