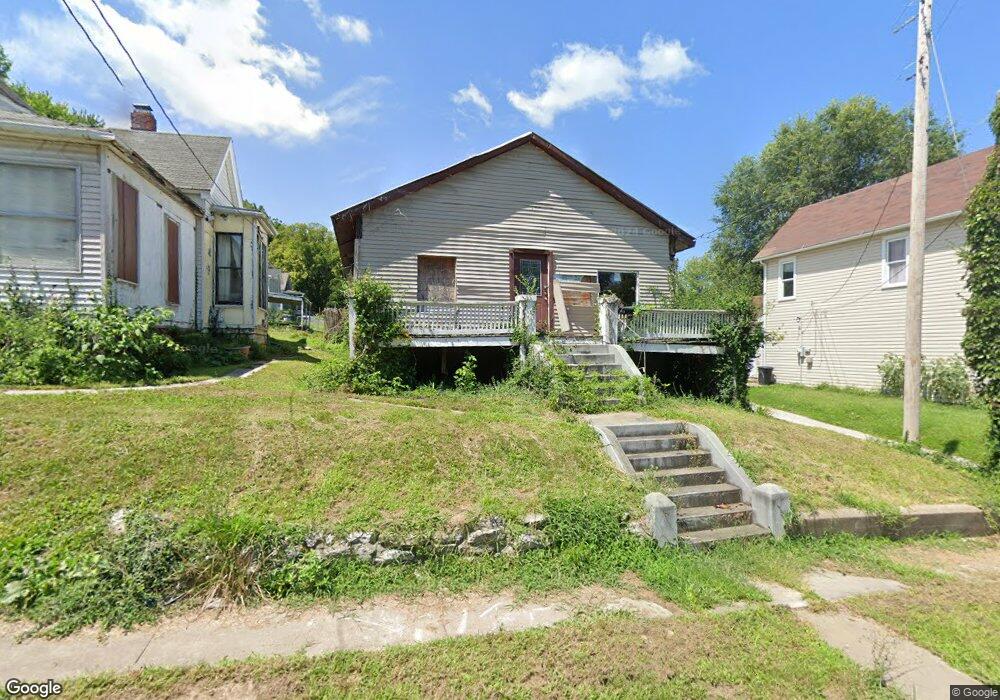
1013 Union St Hannibal, MO 63401
Estimated Value: $67,000 - $107,000
2
Beds
1
Bath
1,102
Sq Ft
$81/Sq Ft
Est. Value
About This Home
This home is located at 1013 Union St, Hannibal, MO 63401 and is currently estimated at $88,762, approximately $80 per square foot. 1013 Union St is a home with nearby schools including Hannibal Senior High School, Holy Family School, and St. John's Lutheran School.
Ownership History
Date
Name
Owned For
Owner Type
Purchase Details
Closed on
Dec 21, 2016
Sold by
Floyd Latisha L J
Bought by
Lindsey Milburn Joe
Current Estimated Value
Purchase Details
Closed on
Aug 8, 2016
Sold by
Lain Andy L
Bought by
Floyd Latisha L J
Purchase Details
Closed on
Mar 23, 2016
Sold by
Lain Christina R and Lain Kevin D
Bought by
Lain Andy L
Purchase Details
Closed on
Mar 21, 2012
Sold by
Town & Country Bank Of Missouri
Bought by
Lain Christina
Home Financials for this Owner
Home Financials are based on the most recent Mortgage that was taken out on this home.
Original Mortgage
$15,000
Interest Rate
3.97%
Mortgage Type
Construction
Purchase Details
Closed on
Jan 4, 2012
Sold by
King Charles D and King Michelle L
Bought by
Town & Country Bank Of Missouri
Create a Home Valuation Report for This Property
The Home Valuation Report is an in-depth analysis detailing your home's value as well as a comparison with similar homes in the area
Home Values in the Area
Average Home Value in this Area
Purchase History
| Date | Buyer | Sale Price | Title Company |
|---|---|---|---|
| Lindsey Milburn Joe | -- | None Available | |
| Floyd Latisha L J | -- | None Available | |
| Lain Andy L | -- | None Available | |
| Lain Christina | -- | None Available | |
| Town & Country Bank Of Missouri | $10,000 | None Available |
Source: Public Records
Mortgage History
| Date | Status | Borrower | Loan Amount |
|---|---|---|---|
| Previous Owner | Lain Christina | $15,000 |
Source: Public Records
Tax History
| Year | Tax Paid | Tax Assessment Tax Assessment Total Assessment is a certain percentage of the fair market value that is determined by local assessors to be the total taxable value of land and additions on the property. | Land | Improvement |
|---|---|---|---|---|
| 2024 | $213 | $3,190 | $270 | $2,920 |
| 2023 | $199 | $3,190 | $270 | $2,920 |
| 2022 | $199 | $3,190 | $270 | $2,920 |
| 2021 | $197 | $3,190 | $270 | $2,920 |
| 2020 | $185 | $2,910 | $250 | $2,660 |
| 2019 | $184 | $2,910 | $250 | $2,660 |
| 2018 | $184 | $2,910 | $250 | $2,660 |
| 2017 | $180 | $2,910 | $250 | $2,660 |
| 2015 | $344 | $6,540 | $230 | $6,310 |
| 2014 | $344 | $6,540 | $230 | $6,310 |
| 2012 | -- | $6,540 | $0 | $0 |
Source: Public Records
Map
Nearby Homes
- 1121 Union St
- 1116 Park Ave
- 1429 Park Ave
- 1620 Fulton Ave
- 612 Church St
- 403 Broadway
- 0 Fifth St Unit MIS26000411
- 221 N 6th St
- 1001 Center St
- 1241 Church St
- 1243 Church St Unit A
- 1008 Center St
- 427 N 7th St
- 1222 Center St
- 212 Division St
- 311 Olive St
- 519 N Section St
- 1801 Hope St
- 1714 Grace St
- 408 Grand Ave
Your Personal Tour Guide
Ask me questions while you tour the home.