Estimated Value: $438,000 - $463,915
4
Beds
3
Baths
2,166
Sq Ft
$209/Sq Ft
Est. Value
About This Home
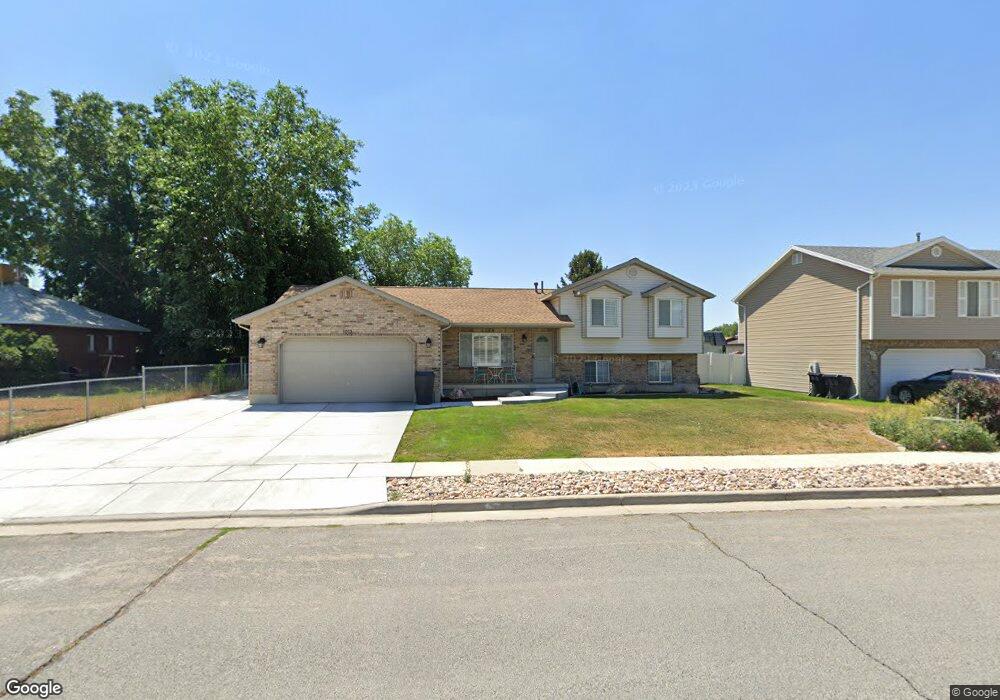
This home is located at 1013 W 4200 S, Ogden, UT 84405 and is currently estimated at $453,729, approximately $209 per square foot. 1013 W 4200 S is a home located in Weber County with nearby schools including Riverdale School, T.H. Bell Junior High School, and Bonneville High School.
Ownership History
Date
Name
Owned For
Owner Type
Purchase Details
Closed on
Jan 7, 2004
Sold by
Cocco Joseph D and Cocco Mary M
Bought by
Thompson Sherry A
Current Estimated Value
Home Financials for this Owner
Home Financials are based on the most recent Mortgage that was taken out on this home.
Original Mortgage
$157,429
Outstanding Balance
$73,521
Interest Rate
5.88%
Mortgage Type
FHA
Estimated Equity
$380,208
Purchase Details
Closed on
May 16, 2001
Sold by
Mike Clark Construction Inc
Bought by
Cocco Joseph D and Cocco Mary M
Home Financials for this Owner
Home Financials are based on the most recent Mortgage that was taken out on this home.
Original Mortgage
$157,416
Interest Rate
7.03%
Mortgage Type
VA
Create a Home Valuation Report for This Property
The Home Valuation Report is an in-depth analysis detailing your home's value as well as a comparison with similar homes in the area
Home Values in the Area
Average Home Value in this Area
Purchase History
| Date | Buyer | Sale Price | Title Company |
|---|---|---|---|
| Thompson Sherry A | -- | Mountain View Title | |
| Cocco Joseph D | -- | U S Title |
Source: Public Records
Mortgage History
| Date | Status | Borrower | Loan Amount |
|---|---|---|---|
| Open | Thompson Sherry A | $157,429 | |
| Previous Owner | Cocco Joseph D | $157,416 |
Source: Public Records
Tax History Compared to Growth
Tax History
| Year | Tax Paid | Tax Assessment Tax Assessment Total Assessment is a certain percentage of the fair market value that is determined by local assessors to be the total taxable value of land and additions on the property. | Land | Improvement |
|---|---|---|---|---|
| 2025 | $2,387 | $422,277 | $137,028 | $285,249 |
| 2024 | $2,283 | $227,149 | $73,248 | $153,901 |
| 2023 | $2,245 | $221,650 | $74,954 | $146,696 |
| 2022 | $2,420 | $243,650 | $69,546 | $174,104 |
| 2021 | $1,613 | $297,000 | $66,782 | $230,218 |
| 2020 | $1,636 | $278,000 | $57,330 | $220,670 |
| 2019 | $1,560 | $251,000 | $51,368 | $199,632 |
| 2018 | $1,450 | $223,000 | $51,368 | $171,632 |
| 2017 | $1,321 | $194,000 | $42,422 | $151,578 |
| 2016 | $1,242 | $99,196 | $21,346 | $77,850 |
| 2015 | $1,218 | $95,095 | $21,346 | $73,749 |
| 2014 | $987 | $76,174 | $21,346 | $54,828 |
Source: Public Records
Map
Nearby Homes
- 1075 W 4175 S
- 4265 S 950 W
- 902 W 4200 S
- 882 W 4150 S
- 875 W 4375 S
- 4290 S 800 W
- 780 W 4075 S
- 751 W 4350 S
- 4409 S 850 W
- 871 W 3875 S
- 1219 W 4500 S
- 3975 Westwind Ct
- 1238 W 4550 S
- 1190 W 4575 S
- 4375 S Weber River Dr Unit 68
- 3937 S Lamplighter Way Unit 23
- 621 Coachman Way
- 3746 Parker Dr
- 4375 Weber River Dr
- 4375 Weber River Dr Unit 123