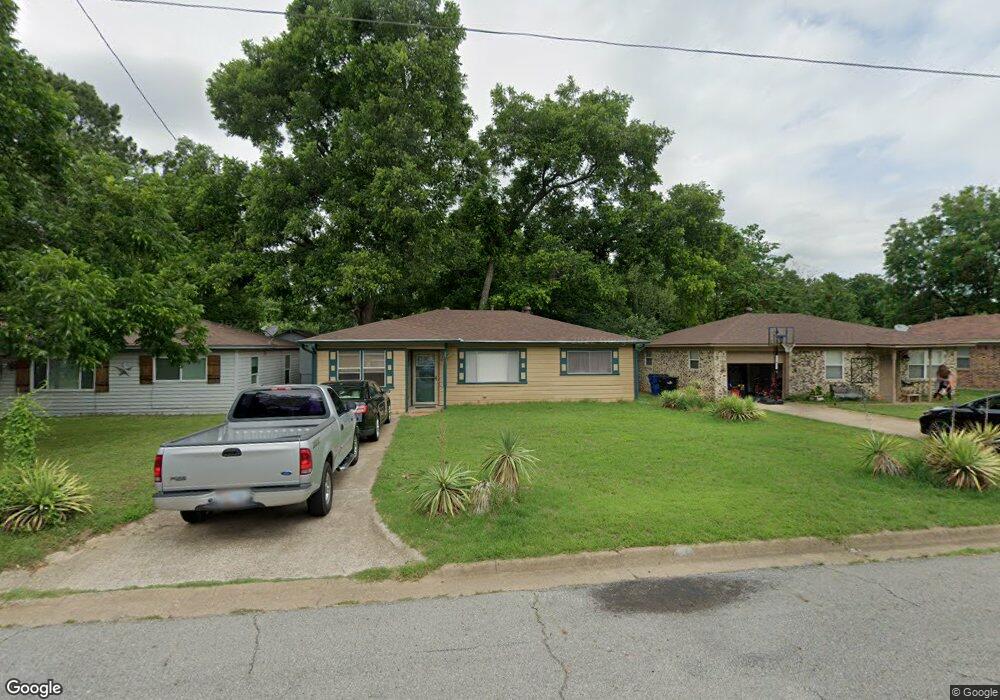
1013 W Florence St Denison, TX 75020
Estimated Value: $129,036 - $168,000
--
Bed
--
Bath
1,160
Sq Ft
$128/Sq Ft
Est. Value
About This Home
This home is located at 1013 W Florence St, Denison, TX 75020 and is currently estimated at $148,518, approximately $128 per square foot. 1013 W Florence St is a home located in Grayson County with nearby schools including Scott Middle School, Denison High School, and St. Luke's Parish Day School.
Ownership History
Date
Name
Owned For
Owner Type
Purchase Details
Closed on
Dec 4, 2007
Sold by
Kelley William D and Kelley Shirley
Bought by
Byrum Kenneth E
Current Estimated Value
Purchase Details
Closed on
Oct 16, 2006
Sold by
Byrum Kenneth E
Bought by
Kelly William D and Kelly Shirley
Purchase Details
Closed on
Sep 12, 2006
Sold by
Beatty Charles Morrison
Bought by
Byrum Kenneth E
Create a Home Valuation Report for This Property
The Home Valuation Report is an in-depth analysis detailing your home's value as well as a comparison with similar homes in the area
Home Values in the Area
Average Home Value in this Area
Purchase History
| Date | Buyer | Sale Price | Title Company |
|---|---|---|---|
| Byrum Kenneth E | -- | None Available | |
| Kelly William D | -- | None Available | |
| Byrum Kenneth E | -- | None Available |
Source: Public Records
Tax History Compared to Growth
Tax History
| Year | Tax Paid | Tax Assessment Tax Assessment Total Assessment is a certain percentage of the fair market value that is determined by local assessors to be the total taxable value of land and additions on the property. | Land | Improvement |
|---|---|---|---|---|
| 2025 | $457 | $90,097 | -- | -- |
| 2024 | $1,903 | $81,906 | $0 | $0 |
| 2023 | $457 | $74,460 | $0 | $0 |
| 2022 | $1,608 | $67,691 | $0 | $0 |
| 2021 | $1,552 | $62,573 | $13,000 | $49,573 |
| 2020 | $1,476 | $60,924 | $9,750 | $51,174 |
| 2019 | $1,399 | $62,566 | $9,750 | $52,816 |
| 2018 | $1,272 | $59,134 | $5,850 | $53,284 |
| 2017 | $1,166 | $51,852 | $3,250 | $48,602 |
| 2016 | $1,060 | $45,840 | $3,250 | $42,590 |
| 2015 | $565 | $34,456 | $3,250 | $31,206 |
| 2014 | $715 | $34,456 | $3,250 | $31,206 |
Source: Public Records
Map
Nearby Homes
- 928 W Chase St
- 930 W Florence St
- 904 W Florence St
- 1044 W Ford St
- 1901 Woodlawn Blvd
- 919 W Collins St
- 923 W Collins St
- 921 W Collins St
- 916 W Collins St
- 527 W Coffin St
- 1705 Woodlawn Blvd
- 1210 W Bullock St
- 1830 Clark Dr
- 1023 W Bullock St
- 1016 W Hanna St
- 736 W Bullock St
- 923 Dubois St
- 603 W Star St
- 0 S Maurice Ave
- 616 & 618 Rice St
- 1015 W Florence St
- 1011 W Florence St
- 1009 W Florence St
- 1025 W Florence St
- 1020 W Ford St
- 1018 W Ford St
- 1027 W Florence St
- 1016 W Ford St
- 1012 W Florence St
- 1010 W Florence St
- 1014 W Florence St
- 1008 W Florence St
- 1026 W Florence St
- 1026 W Florence St Unit A
- 1001 W Florence St
- 1014 W Ford St
- 2203 S College Blvd
- 1006 W Florence St
- 1028 W Florence St
- 1004 W Florence St