1013 Yarrow Unit 9, 26 Howell, MI 48843
Estimated Value: $360,000 - $417,000
2
Beds
3
Baths
1,508
Sq Ft
$260/Sq Ft
Est. Value
About This Home
This home is located at 1013 Yarrow Unit 9, 26, Howell, MI 48843 and is currently estimated at $392,002, approximately $259 per square foot. 1013 Yarrow Unit 9, 26 is a home located in Livingston County with nearby schools including Southwest Elementary School, Parker Middle School, and Howell High School.
Ownership History
Date
Name
Owned For
Owner Type
Purchase Details
Closed on
Mar 7, 2019
Sold by
Bono Vincent G and Bono Elaine M
Bought by
Bono Vincent G and Bono Vincent G
Current Estimated Value
Purchase Details
Closed on
Dec 26, 2018
Sold by
Alm and Gayla
Bought by
Bono Vincent G and Bono Elaine M
Home Financials for this Owner
Home Financials are based on the most recent Mortgage that was taken out on this home.
Original Mortgage
$219,750
Interest Rate
4.9%
Mortgage Type
Stand Alone Refi Refinance Of Original Loan
Purchase Details
Closed on
Jul 19, 2013
Sold by
Mitch Harris Building Company Inc
Bought by
Alm Bruce and Reuter Alm Gayla
Create a Home Valuation Report for This Property
The Home Valuation Report is an in-depth analysis detailing your home's value as well as a comparison with similar homes in the area
Home Values in the Area
Average Home Value in this Area
Purchase History
| Date | Buyer | Sale Price | Title Company |
|---|---|---|---|
| Bono Vincent G | -- | None Listed On Document | |
| Bono Vincent G | $293,000 | Select Title | |
| Alm Bruce | $213,000 | -- |
Source: Public Records
Mortgage History
| Date | Status | Borrower | Loan Amount |
|---|---|---|---|
| Previous Owner | Bono Vincent G | $219,750 |
Source: Public Records
Tax History Compared to Growth
Tax History
| Year | Tax Paid | Tax Assessment Tax Assessment Total Assessment is a certain percentage of the fair market value that is determined by local assessors to be the total taxable value of land and additions on the property. | Land | Improvement |
|---|---|---|---|---|
| 2025 | $2,349 | $185,200 | $0 | $0 |
| 2024 | $2,282 | $182,000 | $0 | $0 |
| 2023 | $2,179 | $173,000 | $0 | $0 |
| 2022 | $2,964 | $149,900 | $0 | $0 |
| 2021 | $2,891 | $149,900 | $0 | $0 |
| 2020 | $2,945 | $152,900 | $0 | $0 |
| 2019 | $2,902 | $127,000 | $0 | $0 |
| 2018 | $2,467 | $123,300 | $0 | $0 |
| 2017 | $2,437 | $119,700 | $0 | $0 |
| 2016 | $2,690 | $114,500 | $0 | $0 |
| 2014 | $629 | $94,400 | $0 | $0 |
| 2012 | $629 | $17,500 | $0 | $0 |
Source: Public Records
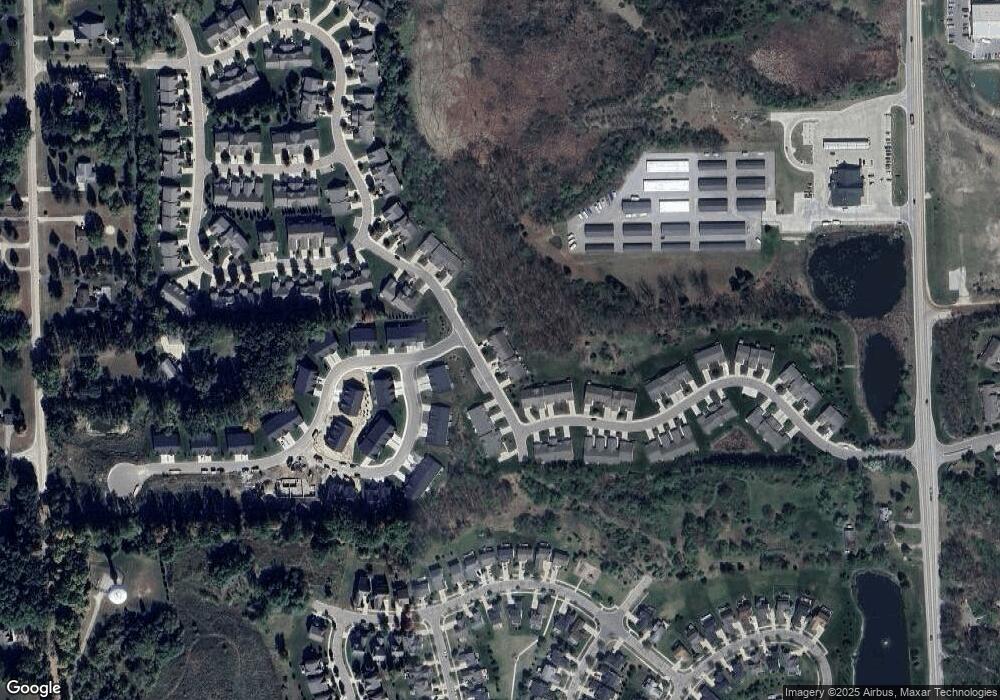
Map
Nearby Homes
- 1031 Camellia Cir Unit 40
- 1025 Camellia Cir Unit 41
- 1034 Camellia Cir Unit 46
- 1044 Camellia Cir Unit 45
- 1054 Camellia Cir Unit 44
- 1012 Camellia Cir Unit 48
- 210 Canyon Creek Ct Unit 2
- 457 Hosta
- 1200 Portsmouth Dr
- 480 Hosta
- 88 Champlain Blvd
- 1071 Tracilee Dr
- 1189 Lockes St
- 1177 Lockes St
- 1201 Lockes St
- Lot 3 of Lockes St
- Lot 1 of Lockes St
- 168 Keddle Rd
- 1073 Weatherstone Ln
- 2058 Dabate Dr
- 1019 Yarrow
- 1019 Yarrow Unit 9
- 1013 Yarrow
- 1013 Yarrow Unit 26
- 1025 Yarrow
- 1025 Yarrow Unit 9, 24
- 1025 Yarrow Unit 24
- 1007 Yarrow
- 1039 Yarrow Unit 23
- 1039 Yarrow
- 1039 Yarrow Unit 8, 23
- 152 Sedum
- 146 Sedum
- 1038 Yarrow Unit 126
- 1038 Yarrow
- 1038 Yarrow Unit 39, 126
- 1044 Yarrow Unit 127
- 1044 Yarrow
- 1044 Yarrow Unit 39, 127
- 1017 Camellia Cir Unit 42