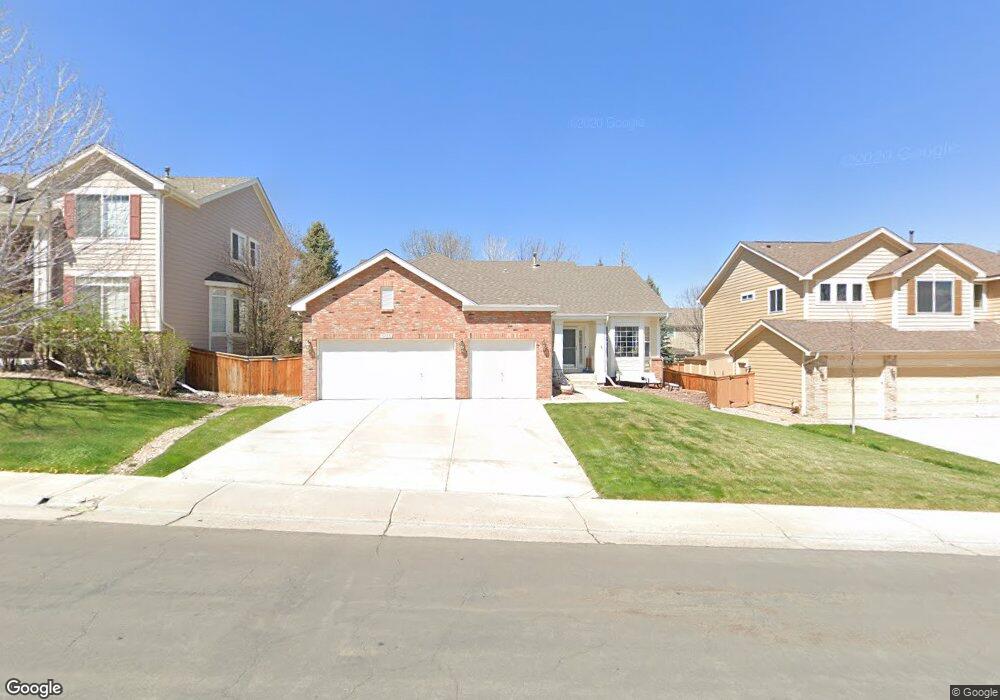
10130 Glenstone Cir Highlands Ranch, CO 80130
Southridge NeighborhoodEstimated Value: $807,768 - $876,000
4
Beds
3
Baths
3,614
Sq Ft
$231/Sq Ft
Est. Value
About This Home
This home is located at 10130 Glenstone Cir, Highlands Ranch, CO 80130 and is currently estimated at $834,442, approximately $230 per square foot. 10130 Glenstone Cir is a home located in Douglas County with nearby schools including Redstone Elementary School, Rocky Heights Middle School, and Rock Canyon High School.
Ownership History
Date
Name
Owned For
Owner Type
Purchase Details
Closed on
Jul 24, 2008
Sold by
Galley Robert C and Galley Patricia A
Bought by
Trujillo Richard E and Cover Therese M
Current Estimated Value
Home Financials for this Owner
Home Financials are based on the most recent Mortgage that was taken out on this home.
Original Mortgage
$304,000
Outstanding Balance
$198,983
Interest Rate
6.36%
Mortgage Type
Unknown
Estimated Equity
$635,459
Purchase Details
Closed on
Jun 25, 1998
Sold by
The Ryland Group Inc
Bought by
Galley Robert C and Galley Patricia A
Home Financials for this Owner
Home Financials are based on the most recent Mortgage that was taken out on this home.
Original Mortgage
$202,000
Interest Rate
7.21%
Purchase Details
Closed on
Feb 2, 1998
Sold by
Shea Homes
Bought by
Ryland Group Inc
Purchase Details
Closed on
Oct 1, 1997
Sold by
Mission Viejo Co
Bought by
Shea Homes
Create a Home Valuation Report for This Property
The Home Valuation Report is an in-depth analysis detailing your home's value as well as a comparison with similar homes in the area
Home Values in the Area
Average Home Value in this Area
Purchase History
| Date | Buyer | Sale Price | Title Company |
|---|---|---|---|
| Trujillo Richard E | $380,000 | Title America | |
| Galley Robert C | $224,458 | Land Title | |
| Ryland Group Inc | $335,300 | -- | |
| Shea Homes | -- | -- |
Source: Public Records
Mortgage History
| Date | Status | Borrower | Loan Amount |
|---|---|---|---|
| Open | Trujillo Richard E | $304,000 | |
| Previous Owner | Galley Robert C | $202,000 |
Source: Public Records
Tax History Compared to Growth
Tax History
| Year | Tax Paid | Tax Assessment Tax Assessment Total Assessment is a certain percentage of the fair market value that is determined by local assessors to be the total taxable value of land and additions on the property. | Land | Improvement |
|---|---|---|---|---|
| 2024 | $4,989 | $56,610 | $12,260 | $44,350 |
| 2023 | $4,980 | $56,610 | $12,260 | $44,350 |
| 2022 | $3,785 | $41,430 | $8,930 | $32,500 |
| 2021 | $3,937 | $41,430 | $8,930 | $32,500 |
| 2020 | $3,605 | $38,870 | $8,120 | $30,750 |
| 2019 | $3,618 | $38,870 | $8,120 | $30,750 |
| 2018 | $3,402 | $36,000 | $7,730 | $28,270 |
| 2017 | $3,098 | $37,450 | $7,730 | $29,720 |
| 2016 | $3,042 | $34,700 | $7,450 | $27,250 |
| 2015 | $3,108 | $34,700 | $7,450 | $27,250 |
| 2014 | $2,936 | $30,270 | $7,320 | $22,950 |
Source: Public Records
Map
Nearby Homes
- 10278 Dan Ct
- 10292 Nickolas Ave
- 5632 Tory Pointe
- 10296 Lauren Ct
- 10439 Cheetah Winds
- 10445 Cheetah Winds
- 10330 Lions Path
- 10375 Lions Heart
- 5639 Jaguar Way
- 10078 Apollo Bay Way
- 10557 Jaguar Dr
- 10541 Jaguar Glen
- 4967 Waldenwood Dr
- 4907 Fenwood Dr
- 10557 Eby Cir
- 4931 Waldenwood Dr
- 10497 Wagon Box Cir
- 9720 Sydney Ln
- 4925 Kingston Ave
- 4848 Fenwood Dr
- 10134 Glenstone Cir
- 10126 Glenstone Cir
- 10147 Nickolas Ave
- 10141 Nickolas Ave
- 10153 Nickolas Ave
- 10120 Glenstone Cir
- 10189 Nickolas Ave
- 10183 Nickolas Ave
- 10131 Glenstone Cir
- 10135 Nickolas Ave
- 10125 Glenstone Cir
- 10135 Glenstone Cir
- 10159 Nickolas Ave
- 10121 Glenstone Cir
- 10114 Glenstone Cir
- 10191 Nickolas Ave
- 10129 Nickolas Ave
- 10115 Glenstone Cir
- 10197 Nickolas Ave
- 10123 Nickolas Ave