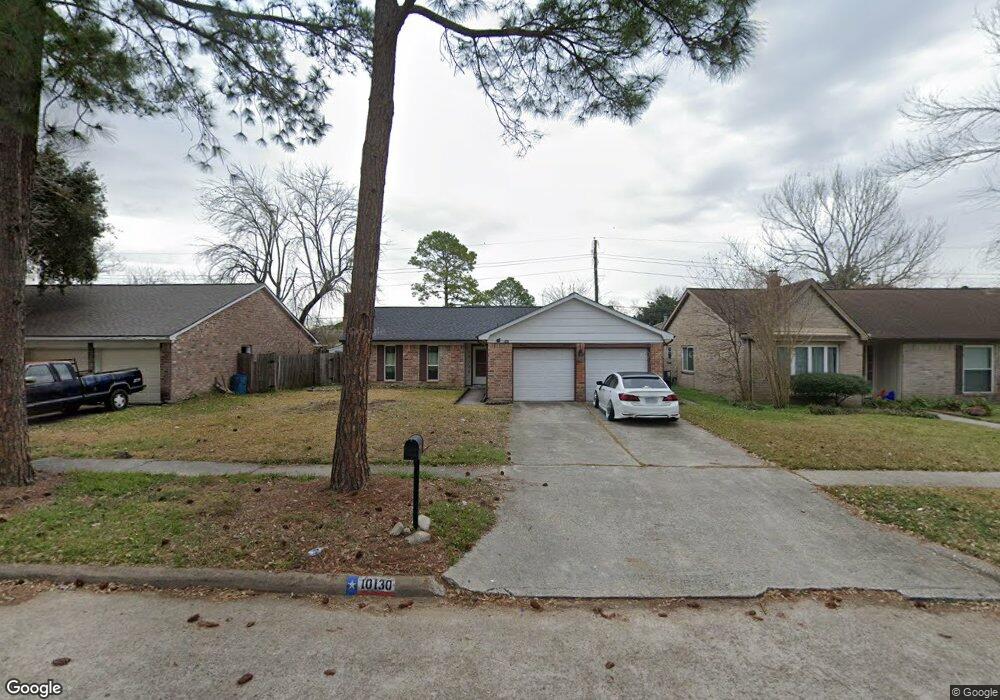
10130 Trade Winds Dr Houston, TX 77086
North Houston NeighborhoodEstimated Value: $221,000 - $249,000
3
Beds
2
Baths
1,792
Sq Ft
$130/Sq Ft
Est. Value
About This Home
This home is located at 10130 Trade Winds Dr, Houston, TX 77086 and is currently estimated at $233,341, approximately $130 per square foot. 10130 Trade Winds Dr is a home located in Harris County with nearby schools including Kujawa EC/Pre-K/K School, Carmichael Elementary School, and Shotwell Middle School.
Ownership History
Date
Name
Owned For
Owner Type
Purchase Details
Closed on
Feb 15, 2013
Sold by
Tu Thai
Bought by
Hy Quang Thieu and Tu Yeu
Current Estimated Value
Purchase Details
Closed on
May 14, 2012
Sold by
Beneficial Financial I Inc
Bought by
Tu Thai
Purchase Details
Closed on
Mar 23, 2012
Sold by
Simpson Teresa
Bought by
Beneficial Financial I Inc
Purchase Details
Closed on
May 18, 2007
Sold by
Nguyen Dang Truong
Bought by
Simpson Teresa
Home Financials for this Owner
Home Financials are based on the most recent Mortgage that was taken out on this home.
Original Mortgage
$64,500
Interest Rate
6.16%
Mortgage Type
Purchase Money Mortgage
Purchase Details
Closed on
Dec 6, 1996
Sold by
Nguyen An Dinh and Nguyen Mary Ann Kim
Bought by
Mai Hung Quoc and Luu Hai Thi
Home Financials for this Owner
Home Financials are based on the most recent Mortgage that was taken out on this home.
Original Mortgage
$48,900
Interest Rate
7.77%
Create a Home Valuation Report for This Property
The Home Valuation Report is an in-depth analysis detailing your home's value as well as a comparison with similar homes in the area
Home Values in the Area
Average Home Value in this Area
Purchase History
| Date | Buyer | Sale Price | Title Company |
|---|---|---|---|
| Hy Quang Thieu | -- | None Available | |
| Tu Thai | -- | Lsi Title Agency Inc | |
| Beneficial Financial I Inc | -- | None Available | |
| Simpson Teresa | -- | Ameripoint Title | |
| Mai Hung Quoc | -- | Regency Title |
Source: Public Records
Mortgage History
| Date | Status | Borrower | Loan Amount |
|---|---|---|---|
| Previous Owner | Simpson Teresa | $64,500 | |
| Previous Owner | Mai Hung Quoc | $48,900 |
Source: Public Records
Tax History Compared to Growth
Tax History
| Year | Tax Paid | Tax Assessment Tax Assessment Total Assessment is a certain percentage of the fair market value that is determined by local assessors to be the total taxable value of land and additions on the property. | Land | Improvement |
|---|---|---|---|---|
| 2025 | $4,042 | $221,376 | $38,674 | $182,702 |
| 2024 | $4,042 | $224,823 | $38,674 | $186,149 |
| 2023 | $4,042 | $229,080 | $38,674 | $190,406 |
| 2022 | $4,276 | $192,860 | $32,775 | $160,085 |
| 2021 | $3,878 | $160,420 | $32,775 | $127,645 |
| 2020 | $3,919 | $149,758 | $32,775 | $116,983 |
| 2019 | $3,705 | $145,827 | $16,696 | $129,131 |
| 2018 | $1,483 | $138,105 | $16,696 | $121,409 |
| 2017 | $2,952 | $129,502 | $14,992 | $114,510 |
| 2016 | $2,684 | $115,595 | $14,992 | $100,603 |
| 2015 | $2,221 | $108,979 | $14,992 | $93,987 |
| 2014 | $2,221 | $81,951 | $14,992 | $66,959 |
Source: Public Records
Map
Nearby Homes
- 10214 Trade Winds Dr
- 6703 Deer Ridge Ln
- 6606 Dusty Dawn Dr
- 6706 Redding Springs Ln
- 10306 Jillana Kaye Dr
- 6830 Desert Rose Ln
- 10730 Antoine Dr
- 6822 Dusty Dawn Dr
- 6622 Sutton Meadows Dr
- 6411 Halstead Meadows Cir
- 6502 Trail Valley Way
- 7011 Lower Arrow Dr
- 6911 Silver Star Dr
- 9815 Lonsford Dr
- 3265 Frick Rd
- 0 Tomball Pkwy
- 10522 Northview Dr
- 5914 Stirring Winds Ln
- 6615 Winding Trace Dr
- 13518 Kaltenbrun Rd
- 10130 Trade Wind
- 10134 Trade Winds Dr
- 10126 Trade Winds Dr
- 10131 Northview Dr
- 10135 Northview Dr
- 10138 Trade Winds Dr
- 10122 Trade Winds Dr
- 10127 Northview Dr
- 10139 Northview Dr
- 10123 Northview Dr
- 10131 Trade Winds Dr
- 10127 Trade Winds Dr
- 10142 Trade Winds Dr
- 10118 Trade Winds Dr
- 10135 Trade Winds Dr
- 10123 Trade Winds Dr
- 10143 Northview Dr
- 10119 Northview Dr
- 10139 Trade Winds Dr
- 10119 Trade Winds Dr