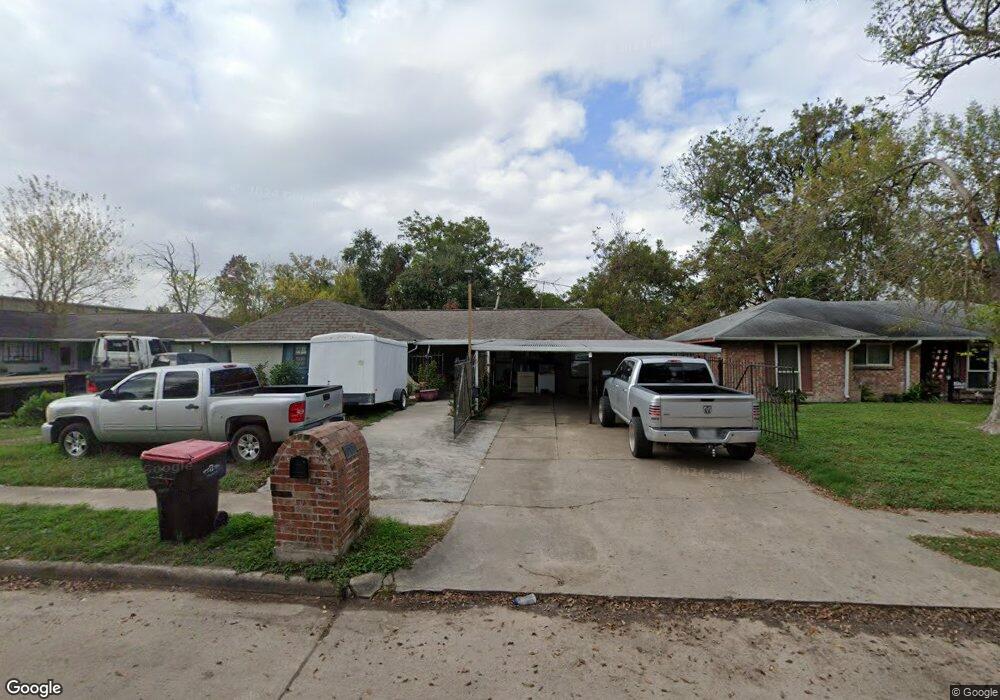
10131 Ella Blvd Houston, TX 77038
North Houston NeighborhoodEstimated Value: $238,963 - $252,000
3
Beds
2
Baths
1,832
Sq Ft
$135/Sq Ft
Est. Value
About This Home
This home is located at 10131 Ella Blvd, Houston, TX 77038 and is currently estimated at $246,741, approximately $134 per square foot. 10131 Ella Blvd is a home located in Harris County with nearby schools including Jerry Keeble Ec/Pre-K, Gray Elementary School, and Aldine Ninth Grade School.
Ownership History
Date
Name
Owned For
Owner Type
Purchase Details
Closed on
May 13, 2014
Sold by
Bautista Martin Candelario
Bought by
Gonzalez Maria De La Luz
Current Estimated Value
Purchase Details
Closed on
Jul 26, 2003
Sold by
Nguyen Tiffany Hong
Bought by
Baustista Martin C
Home Financials for this Owner
Home Financials are based on the most recent Mortgage that was taken out on this home.
Original Mortgage
$86,500
Interest Rate
4.61%
Mortgage Type
Seller Take Back
Purchase Details
Closed on
Jul 16, 2003
Sold by
Bang Danh
Bought by
Nguyen Tiffany Hong
Home Financials for this Owner
Home Financials are based on the most recent Mortgage that was taken out on this home.
Original Mortgage
$86,500
Interest Rate
4.61%
Mortgage Type
Seller Take Back
Purchase Details
Closed on
Oct 17, 1996
Sold by
Brinkley Dalton W and Brinkley Cora Lee
Bought by
Bang Danh
Create a Home Valuation Report for This Property
The Home Valuation Report is an in-depth analysis detailing your home's value as well as a comparison with similar homes in the area
Home Values in the Area
Average Home Value in this Area
Purchase History
| Date | Buyer | Sale Price | Title Company |
|---|---|---|---|
| Gonzalez Maria De La Luz | -- | None Available | |
| Baustista Martin C | -- | American Title Co | |
| Nguyen Tiffany Hong | -- | American Title Co | |
| Nguyen Tiffany Hong | -- | -- | |
| Bang Danh | -- | Fidelity National Title |
Source: Public Records
Mortgage History
| Date | Status | Borrower | Loan Amount |
|---|---|---|---|
| Previous Owner | Baustista Martin C | $86,500 |
Source: Public Records
Tax History Compared to Growth
Tax History
| Year | Tax Paid | Tax Assessment Tax Assessment Total Assessment is a certain percentage of the fair market value that is determined by local assessors to be the total taxable value of land and additions on the property. | Land | Improvement |
|---|---|---|---|---|
| 2025 | $2,692 | $233,324 | $32,981 | $200,343 |
| 2024 | $2,692 | $233,324 | $32,981 | $200,343 |
| 2023 | $2,692 | $236,912 | $32,981 | $203,931 |
| 2022 | $3,929 | $187,859 | $26,110 | $161,749 |
| 2021 | $3,724 | $155,129 | $26,659 | $128,470 |
| 2020 | $3,127 | $126,032 | $25,560 | $100,472 |
| 2019 | $2,957 | $116,655 | $25,560 | $91,095 |
| 2018 | $1,093 | $101,096 | $12,610 | $88,486 |
| 2017 | $3,425 | $132,956 | $12,610 | $120,346 |
| 2016 | $2,860 | $111,004 | $12,610 | $98,394 |
| 2015 | $1,600 | $111,004 | $12,610 | $98,394 |
| 2014 | $1,600 | $91,882 | $12,610 | $79,272 |
Source: Public Records
Map
Nearby Homes
- 1006 Fruitvale Dr
- 1010 Francitas Dr
- 10134 Lasaber Ct
- 10226 Ella Falls Blvd
- 1022 Progreso Dr
- 939 Point Blank Dr
- 10026 Lasaber Ct
- 1138 Cherry Spring Dr
- 1219 Pilot Point Dr
- 1019 Castolan Dr
- 1506 Wilshire Park Dr
- 10519 Pleasanton Dr
- 1327 Fallbrook Dr
- 00 Fallbrook Dr
- 10558 Pleasanton Dr
- 0 W Mt Houston Rd Unit 90464120
- 9710 Debbie Ln
- 2115 Havencrest Dr
- 2203 Chalet Rd
- 12718 Sai Baba Dr
- 10135 Ella Blvd
- 10127 Ella Blvd
- 10134 Scotsbrook Dr
- 10139 Ella Blvd
- 903 Fruitvale Dr
- 10138 Scotsbrook Dr
- 10143 Ella Blvd
- 10142 Scotsbrook Dr
- 10130 Ella Blvd
- 10126 Ella Blvd
- 10134 Ella Blvd
- 907 Fruitvale Dr
- 10147 Ella Falls Blvd
- 10138 Ella Blvd
- 10147 Ella Blvd
- 10146 Scotsbrook Dr
- 10142 Ella Blvd
- 910 Fruitvale Dr
- 911 Fruitvale Dr
- 10131 Whitebrook Dr