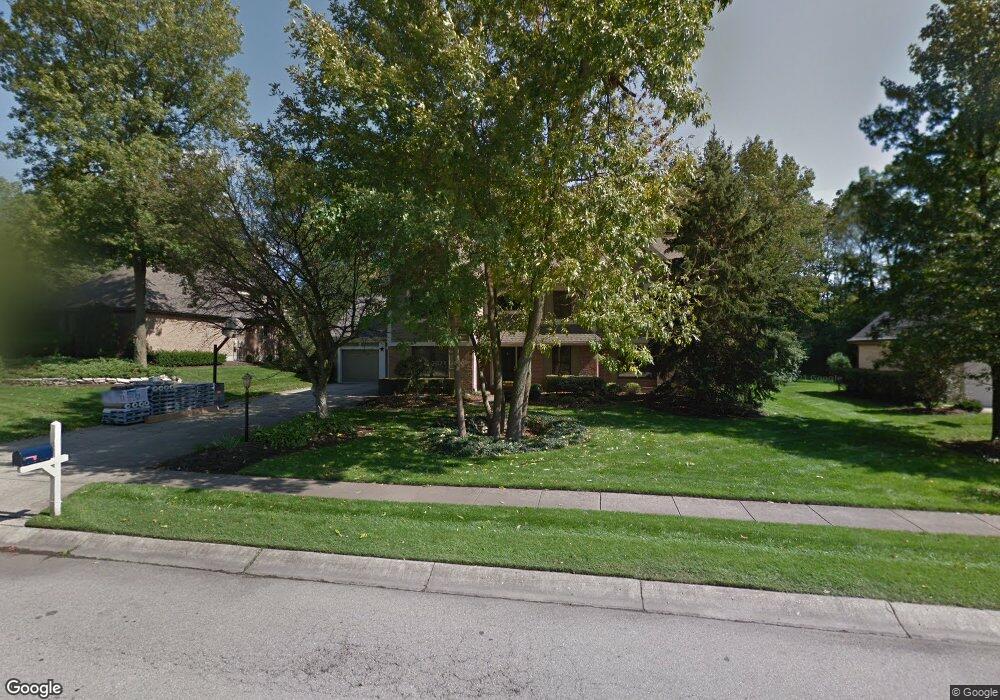
10132 Park Edge Dr Dayton, OH 45458
Estimated Value: $525,124 - $648,000
4
Beds
3
Baths
3,241
Sq Ft
$177/Sq Ft
Est. Value
About This Home
This home is located at 10132 Park Edge Dr, Dayton, OH 45458 and is currently estimated at $572,281, approximately $176 per square foot. 10132 Park Edge Dr is a home located in Montgomery County with nearby schools including Primary Village South, Weller Elementary School, and Magsig Middle School.
Ownership History
Date
Name
Owned For
Owner Type
Purchase Details
Closed on
Jul 13, 2022
Sold by
Nielsen Jr Curtis G and Nielsen Karen E
Bought by
Nielsen Curtis G and Nielsen Karen E
Current Estimated Value
Purchase Details
Closed on
Aug 10, 2001
Sold by
Simmons Garrett W and Simmons Diane E
Bought by
Nielsen Curtis G and Nielsen Karen E
Home Financials for this Owner
Home Financials are based on the most recent Mortgage that was taken out on this home.
Original Mortgage
$175,000
Interest Rate
7.11%
Purchase Details
Closed on
Jun 23, 1999
Sold by
Mooney Beth E
Bought by
Simmons Garrett W and Simmons Diane E
Home Financials for this Owner
Home Financials are based on the most recent Mortgage that was taken out on this home.
Original Mortgage
$125,000
Interest Rate
7.28%
Mortgage Type
Balloon
Purchase Details
Closed on
Oct 16, 1995
Sold by
Lienesch Dolores S
Bought by
Mooney Beth E
Create a Home Valuation Report for This Property
The Home Valuation Report is an in-depth analysis detailing your home's value as well as a comparison with similar homes in the area
Purchase History
| Date | Buyer | Sale Price | Title Company |
|---|---|---|---|
| Nielsen Curtis G | -- | None Listed On Document | |
| Nielsen Curtis G | $308,000 | Scioto Title Services | |
| Simmons Garrett W | $298,000 | Landmark Title Agency Inc | |
| Mooney Beth E | -- | -- |
Source: Public Records
Mortgage History
| Date | Status | Borrower | Loan Amount |
|---|---|---|---|
| Previous Owner | Nielsen Curtis G | $175,000 | |
| Previous Owner | Simmons Garrett W | $125,000 |
Source: Public Records
Tax History
| Year | Tax Paid | Tax Assessment Tax Assessment Total Assessment is a certain percentage of the fair market value that is determined by local assessors to be the total taxable value of land and additions on the property. | Land | Improvement |
|---|---|---|---|---|
| 2025 | $9,315 | $138,990 | $30,870 | $108,120 |
| 2024 | $8,559 | $138,990 | $30,870 | $108,120 |
| 2023 | $8,559 | $138,990 | $30,870 | $108,120 |
| 2022 | $8,579 | $110,250 | $24,500 | $85,750 |
| 2021 | $8,603 | $110,250 | $24,500 | $85,750 |
| 2020 | $8,591 | $110,250 | $24,500 | $85,750 |
| 2019 | $8,549 | $98,040 | $24,500 | $73,540 |
| 2018 | $7,635 | $98,040 | $24,500 | $73,540 |
| 2017 | $7,553 | $98,040 | $24,500 | $73,540 |
| 2016 | $8,419 | $103,030 | $24,500 | $78,530 |
| 2015 | $8,283 | $103,030 | $24,500 | $78,530 |
| 2014 | $8,283 | $103,030 | $24,500 | $78,530 |
| 2012 | -- | $103,100 | $28,000 | $75,100 |
Source: Public Records
Map
Nearby Homes
- 9161 Remy
- 9197 Remy Ct
- 9230 Bottega South Dr Unit 38
- 9155 Remy Ct
- 9215 Bottega South Dr Unit 66
- 9644 Bridlewood Trail
- 1070 Green Timber Trail
- 488 Saddle Park Ct
- 9515 Centerbrook Ct Unit 69515
- 1332 Clydesdale Ct
- 9119 Remy
- 9106 Remy Ct
- 9750 Centerville Creek Ln
- 154 Queens Crossing Unit 31152
- 244 Queens Crossing Unit 23119
- 244 Queens Crossing Unit 119
- 222 E Social Row Rd
- 1886 Horseshoe Bend
- 460 Jamestown Cir Unit 16
- 1016 Quiet Brook Trail
- 10140 Park Edge Dr
- 10124 Park Edge Dr
- 10325 Apple Park Ct
- 10148 Park Edge Dr
- 10116 Park Edge Dr
- 10335 Apple Park Ct
- 10315 Apple Park Ct
- 10127 Park Edge Dr
- 10137 Park Edge Dr
- 10119 Park Edge Dr
- 10345 Apple Park Ct
- 10305 Apple Park Ct
- 10108 Park Edge Dr
- 1111 Stone Brook Ct
- 10153 Park Edge Dr
- 1119 Stone Brook Ct
- 10111 Apple Springs Dr
- 10100 Park Edge Dr
- 10324 Apple Park Ct
- 10355 Apple Park Ct