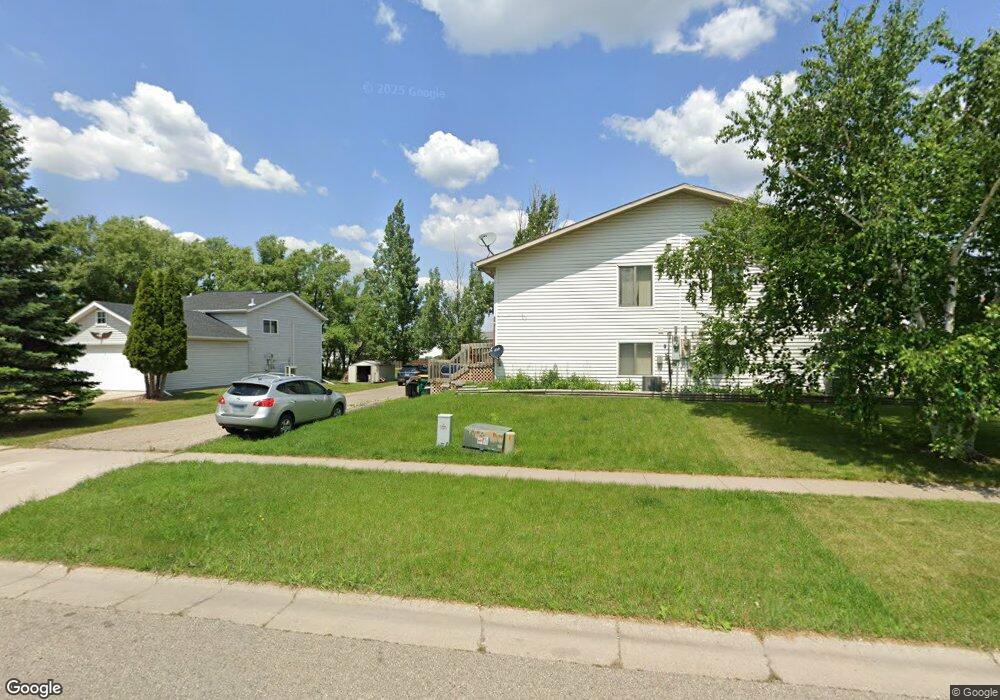
1014 14 Ave W West Fargo, ND 58078
Sheyenne Park NeighborhoodEstimated Value: $227,000 - $229,604
3
Beds
2
Baths
880
Sq Ft
$259/Sq Ft
Est. Value
About This Home
This home is located at 1014 14 Ave W, West Fargo, ND 58078 and is currently estimated at $228,302, approximately $259 per square foot. 1014 14 Ave W is a home located in Cass County with nearby schools including Westside Elementary School, Cheney Middle School, and West Fargo High School.
Ownership History
Date
Name
Owned For
Owner Type
Purchase Details
Closed on
Apr 17, 2013
Sold by
Nightingale Mark D and Nightingale Kellie E
Bought by
Peterson Michelle C
Current Estimated Value
Home Financials for this Owner
Home Financials are based on the most recent Mortgage that was taken out on this home.
Original Mortgage
$110,953
Outstanding Balance
$78,777
Interest Rate
3.6%
Mortgage Type
FHA
Estimated Equity
$149,525
Purchase Details
Closed on
Sep 10, 2010
Sold by
Braun Terry J and Braun Susan L
Bought by
Nightingale Mark D and Nightingale Kellie E
Home Financials for this Owner
Home Financials are based on the most recent Mortgage that was taken out on this home.
Original Mortgage
$103,588
Interest Rate
4.85%
Mortgage Type
FHA
Purchase Details
Closed on
May 20, 2010
Sold by
Christiansen Brett
Bought by
Braun Terry J and Braun Susan L
Purchase Details
Closed on
Nov 16, 2007
Sold by
Aspen Heights Development
Bought by
Christiansen Brett
Home Financials for this Owner
Home Financials are based on the most recent Mortgage that was taken out on this home.
Original Mortgage
$93,163
Interest Rate
6%
Mortgage Type
FHA
Create a Home Valuation Report for This Property
The Home Valuation Report is an in-depth analysis detailing your home's value as well as a comparison with similar homes in the area
Home Values in the Area
Average Home Value in this Area
Purchase History
| Date | Buyer | Sale Price | Title Company |
|---|---|---|---|
| Peterson Michelle C | $113,000 | None Available | |
| Nightingale Mark D | -- | -- | |
| Braun Terry J | -- | -- | |
| Christiansen Brett | -- | -- |
Source: Public Records
Mortgage History
| Date | Status | Borrower | Loan Amount |
|---|---|---|---|
| Open | Peterson Michelle C | $110,953 | |
| Previous Owner | Nightingale Mark D | $103,588 | |
| Previous Owner | Christiansen Brett | $93,163 |
Source: Public Records
Tax History Compared to Growth
Tax History
| Year | Tax Paid | Tax Assessment Tax Assessment Total Assessment is a certain percentage of the fair market value that is determined by local assessors to be the total taxable value of land and additions on the property. | Land | Improvement |
|---|---|---|---|---|
| 2024 | $2,706 | $87,200 | $12,500 | $74,700 |
| 2023 | $2,665 | $85,800 | $12,500 | $73,300 |
| 2022 | $2,634 | $81,550 | $12,500 | $69,050 |
| 2021 | $2,551 | $70,800 | $6,250 | $64,550 |
| 2020 | $2,478 | $70,000 | $6,250 | $63,750 |
| 2019 | $2,278 | $67,200 | $6,250 | $60,950 |
| 2018 | $2,131 | $64,300 | $6,250 | $58,050 |
| 2017 | $2,075 | $64,300 | $6,250 | $58,050 |
| 2016 | $1,805 | $59,300 | $6,250 | $53,050 |
| 2015 | $1,716 | $50,650 | $6,200 | $44,450 |
| 2014 | $1,699 | $47,350 | $6,200 | $41,150 |
| 2013 | $1,579 | $46,250 | $5,100 | $41,150 |
Source: Public Records
Map
Nearby Homes
- 1014 14th Ave W
- 1010 14 Ave W Unit 1016
- 1010 14th Ave W
- 1016 14th Ave W
- 1020 14th Ave W
- 1012 14th Ave W
- 1006 14th Ave W
- 1006 14 Ave W
- 1008 14th Ave W
- 1008 14 Ave W
- 1405 11th St W
- 1024 14 Ave W
- 1002 14 Ave W Unit 1008
- 961 14 Ave W
- 1002 14th Ave W
- 1407 11th St W
- 1004 14th Ave W
- 1404 10th St W
- 1409 11th St W
- 1402 11th St W