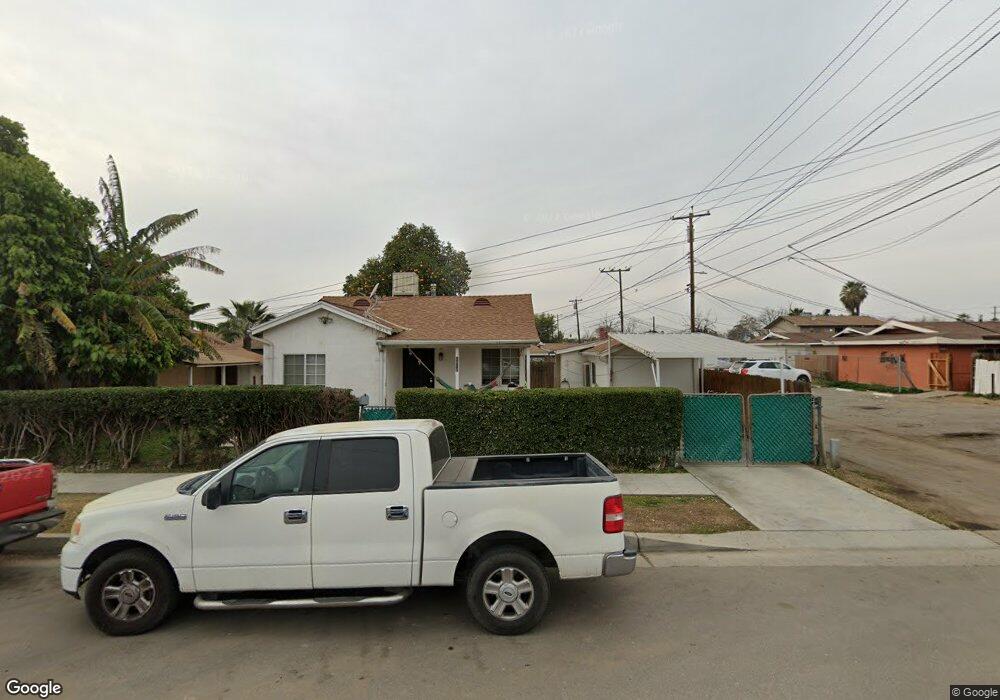
1014 Brown St Bakersfield, CA 93305
East Bakersfield NeighborhoodEstimated Value: $153,000 - $193,000
2
Beds
1
Bath
684
Sq Ft
$240/Sq Ft
Est. Value
About This Home
This home is located at 1014 Brown St, Bakersfield, CA 93305 and is currently estimated at $163,899, approximately $239 per square foot. 1014 Brown St is a home located in Kern County with nearby schools including Williams Elementary School, Walter Stiern Middle School, and East Bakersfield High School.
Ownership History
Date
Name
Owned For
Owner Type
Purchase Details
Closed on
Feb 23, 1995
Sold by
Unkrey Howard Willis and Unkrey Sophie
Bought by
Perla Jose F and Perla Edith T
Current Estimated Value
Home Financials for this Owner
Home Financials are based on the most recent Mortgage that was taken out on this home.
Original Mortgage
$40,350
Interest Rate
9.09%
Purchase Details
Closed on
Oct 27, 1994
Sold by
Unkrey Sophie Lozano
Bought by
Unkrey Sophie and Lozano Philip A
Create a Home Valuation Report for This Property
The Home Valuation Report is an in-depth analysis detailing your home's value as well as a comparison with similar homes in the area
Home Values in the Area
Average Home Value in this Area
Purchase History
| Date | Buyer | Sale Price | Title Company |
|---|---|---|---|
| Perla Jose F | $42,500 | Chicago Title Company | |
| Unkrey Sophie | -- | -- |
Source: Public Records
Mortgage History
| Date | Status | Borrower | Loan Amount |
|---|---|---|---|
| Closed | Perla Jose F | $40,350 |
Source: Public Records
Tax History
| Year | Tax Paid | Tax Assessment Tax Assessment Total Assessment is a certain percentage of the fair market value that is determined by local assessors to be the total taxable value of land and additions on the property. | Land | Improvement |
|---|---|---|---|---|
| 2025 | $1,530 | $71,353 | $23,498 | $47,855 |
| 2024 | $1,530 | $69,955 | $23,038 | $46,917 |
| 2023 | $1,492 | $68,585 | $22,587 | $45,998 |
| 2022 | $1,445 | $67,242 | $22,145 | $45,097 |
| 2021 | $1,346 | $65,924 | $21,711 | $44,213 |
| 2020 | $1,312 | $65,249 | $21,489 | $43,760 |
| 2019 | $1,287 | $65,249 | $21,489 | $43,760 |
| 2018 | $1,260 | $62,716 | $20,655 | $42,061 |
| 2017 | $1,245 | $61,000 | $20,000 | $41,000 |
| 2016 | $1,033 | $48,000 | $12,000 | $36,000 |
| 2015 | $973 | $43,000 | $11,000 | $32,000 |
| 2014 | $1,086 | $55,000 | $14,000 | $41,000 |
Source: Public Records
Map
Nearby Homes
- 1326 Kentucky St Unit B
- 1600 Kentucky St
- 1414 Monterey St
- 1417 Oregon St
- 1413 Oregon St
- 1106 Kentucky St
- 1302 E 19th St
- 1107 Monterey St
- 1104 Gage St
- 1316 Pacific St
- 1836 Niles St
- 1222 E 18th St
- 1311 E 18th St
- 1530 Quincy St
- 1720 Pacific St
- 1821 Pacific St
- 1107 Pacific St
- 1322 Quincy St
- 1032 E 19th St Unit 3
- 931 Monterey St
Your Personal Tour Guide
Ask me questions while you tour the home.