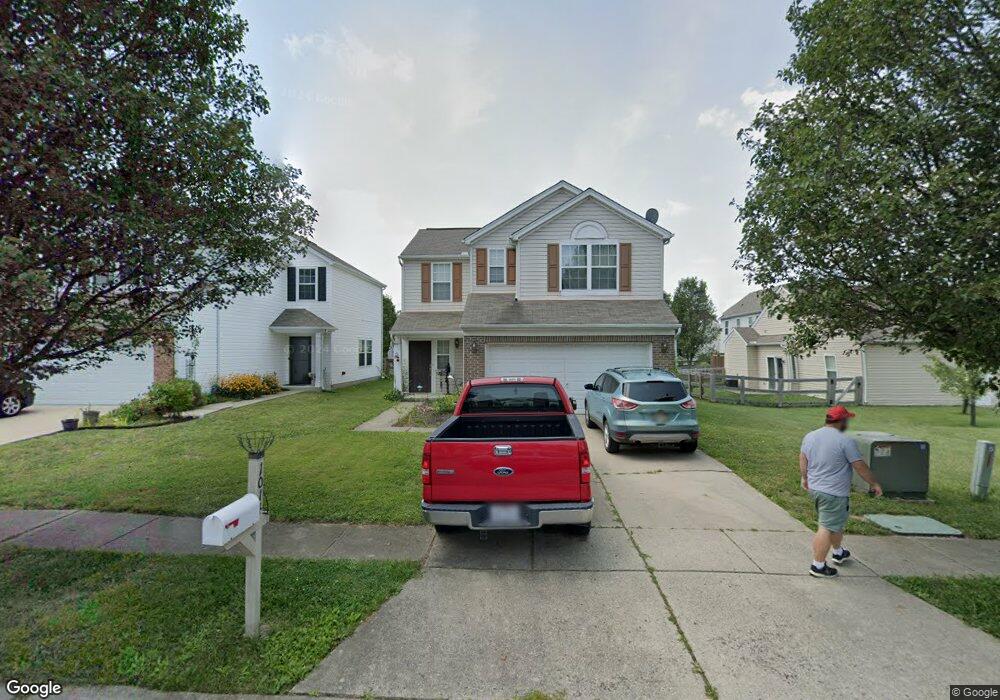
1014 Canterbury Ln Loveland, OH 45140
Estimated Value: $273,000 - $297,000
3
Beds
3
Baths
1,550
Sq Ft
$183/Sq Ft
Est. Value
About This Home
This home is located at 1014 Canterbury Ln, Loveland, OH 45140 and is currently estimated at $283,860, approximately $183 per square foot. 1014 Canterbury Ln is a home located in Clermont County with nearby schools including Marr/Cook Elementary School, Spaulding Elementary School, and Goshen Middle School.
Ownership History
Date
Name
Owned For
Owner Type
Purchase Details
Closed on
Jun 1, 2007
Sold by
Bank Of New York
Bought by
Jones Kevin J and Jones Sandra
Current Estimated Value
Home Financials for this Owner
Home Financials are based on the most recent Mortgage that was taken out on this home.
Original Mortgage
$135,600
Outstanding Balance
$83,063
Interest Rate
6.21%
Mortgage Type
Purchase Money Mortgage
Estimated Equity
$200,797
Purchase Details
Closed on
Dec 19, 2006
Sold by
Gadker Kevin J
Bought by
Bank Of New York
Purchase Details
Closed on
Jul 30, 2004
Sold by
M/I Homes Of Cincinnati Llc
Bought by
Gadker Kevin J
Home Financials for this Owner
Home Financials are based on the most recent Mortgage that was taken out on this home.
Original Mortgage
$30,028
Interest Rate
5.75%
Mortgage Type
Stand Alone Second
Create a Home Valuation Report for This Property
The Home Valuation Report is an in-depth analysis detailing your home's value as well as a comparison with similar homes in the area
Home Values in the Area
Average Home Value in this Area
Purchase History
| Date | Buyer | Sale Price | Title Company |
|---|---|---|---|
| Jones Kevin J | $135,600 | Resource Title Agency Inc | |
| Bank Of New York | $100,000 | None Available | |
| Gadker Kevin J | $150,200 | -- |
Source: Public Records
Mortgage History
| Date | Status | Borrower | Loan Amount |
|---|---|---|---|
| Open | Jones Kevin J | $135,600 | |
| Previous Owner | Gadker Kevin J | $30,028 | |
| Previous Owner | Gadker Kevin J | $120,110 |
Source: Public Records
Tax History Compared to Growth
Tax History
| Year | Tax Paid | Tax Assessment Tax Assessment Total Assessment is a certain percentage of the fair market value that is determined by local assessors to be the total taxable value of land and additions on the property. | Land | Improvement |
|---|---|---|---|---|
| 2024 | $3,450 | $75,990 | $13,200 | $62,790 |
| 2023 | $3,334 | $75,990 | $13,200 | $62,790 |
| 2022 | $2,621 | $52,360 | $9,100 | $43,260 |
| 2021 | $2,636 | $52,360 | $9,100 | $43,260 |
| 2020 | $2,466 | $52,360 | $9,100 | $43,260 |
| 2019 | $2,245 | $45,650 | $8,790 | $36,860 |
| 2018 | $2,254 | $45,650 | $8,790 | $36,860 |
| 2017 | $2,064 | $45,650 | $8,790 | $36,860 |
| 2016 | $2,114 | $40,040 | $7,700 | $32,340 |
| 2015 | $1,863 | $40,040 | $7,700 | $32,340 |
| 2014 | $1,863 | $40,040 | $7,700 | $32,340 |
| 2013 | $1,766 | $39,620 | $8,750 | $30,870 |
Source: Public Records
Map
Nearby Homes
- 1019 Canterbury Ln
- 2066 Cameron Crossing
- 6442 Charles Snider Rd
- 3009 Abby Way
- 5934 Marsh Cir
- 5997 Marsh Cir
- 411 Catrina Ct
- 5718 Clemens Dr
- 374a Redbird Dr
- 1786 Broadstone Cir
- Birch with Full Basement Plan at Barclay Woods
- Elder with Full Basement Plan at Barclay Woods
- Cedar with Full Basement Plan at Barclay Woods
- Tupelo with Full Basement Plan at Barclay Woods
- Aspen with Full Basement Plan at Barclay Woods
- 6540 Glen Eagle Way
- 6554 Glen Eagle Way
- 6535 Glen Eagle Way
- 1811 Louis Ln
- 6590 Oakland Rd
- 1016 Canterbury Ln
- 1018 Canterbury Ln
- 1501 Dorset Way
- 1505 Dorset Way
- 1020 Canterbury Ln
- 1015 Canterbury Ln
- 1507 Dorset Way
- 1017 Canterbury Ln
- 1022 Canterbury Ln
- 1509 Dorset Way
- 1021 Canterbury Ln
- 1511 Dorset Way
- 1023 Canterbury Ln
- 1025 Canterbury Ln
- 1713 Arundel Ct
- 1506 Dorset Way
- 1711 Arundel Ct
- 1709 Arundel Ct
- 1715 Arundel Ct
- 1705 Arundel Ct