
Seller's Agent in 2025
Maurey Bell
Bell Properties
(979) 218-1565
3 in this area
240 Total Sales
Estimated Value: $384,000 - $895,000
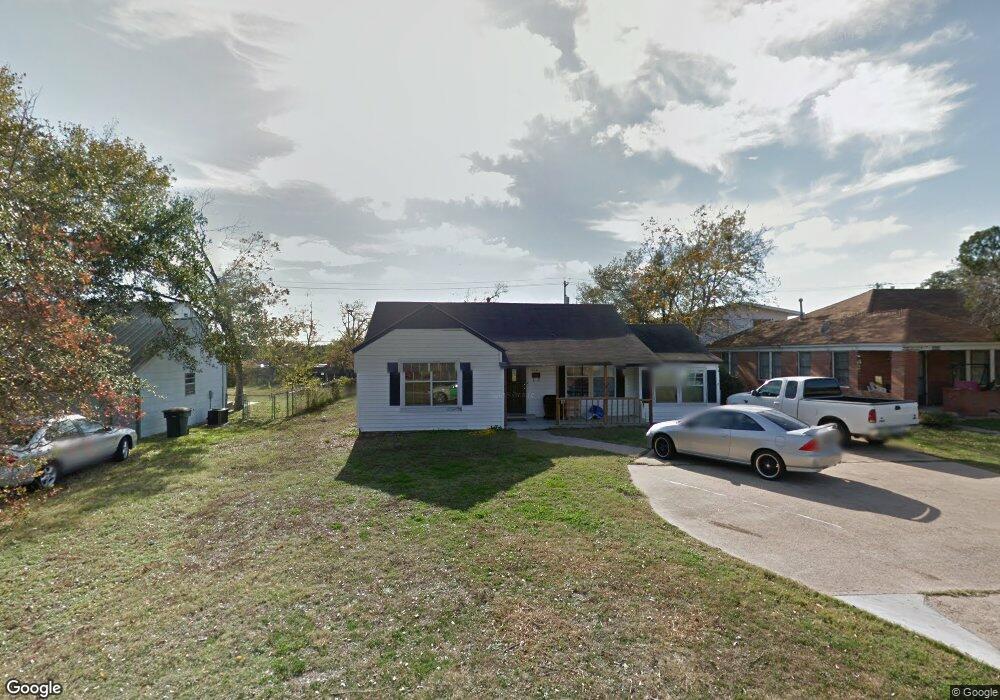
Preleasing for 8/5/2026!!
Modern and Industrial, 4-bed, 4-bath duplex near TAMU, close to shopping and dining. large, open concept living, kitchen, and dining area, plenty of parking, extra-large bedrooms, bathrooms and walk=in closets. Includes lawn care, pest control and washer/dryer. Schedule a showing today!! ***If applications are not received 72 hours after the security deposit is paid, security deposit will be forfeited. Any applicants that are not approved will receive a 100% refund on the deposit***
| Date | Buyer | Sale Price | Title Company |
|---|---|---|---|
| Spicewood Llc | -- | University Title |
| Date | Event | Price | List to Sale | Price per Sq Ft |
|---|---|---|---|---|
| 10/10/2025 10/10/25 | Rented | $3,600 | 0.0% | -- |
| 09/29/2025 09/29/25 | Under Contract | -- | -- | -- |
| 09/12/2025 09/12/25 | Price Changed | $3,600 | -10.0% | $2 / Sq Ft |
| 09/11/2025 09/11/25 | For Rent | $4,000 | +400.0% | -- |
| 09/11/2025 09/11/25 | For Rent | $800 | -75.0% | -- |
| 07/17/2025 07/17/25 | Price Changed | $3,200 | -19.0% | $2 / Sq Ft |
| 07/08/2025 07/08/25 | Price Changed | $3,950 | -1.3% | $2 / Sq Ft |
| 02/28/2025 02/28/25 | For Rent | $4,000 | +27.6% | -- |
| 03/17/2024 03/17/24 | Off Market | $3,135 | -- | -- |
| 01/30/2024 01/30/24 | Rented | $3,135 | 0.0% | -- |
| 01/08/2024 01/08/24 | Under Contract | -- | -- | -- |
| 12/13/2023 12/13/23 | For Rent | $3,135 | +10.0% | -- |
| 01/27/2022 01/27/22 | Rented | $2,850 | -1.7% | -- |
| 12/28/2021 12/28/21 | Under Contract | -- | -- | -- |
| 10/20/2021 10/20/21 | For Rent | $2,900 | +16.0% | -- |
| 01/23/2019 01/23/19 | For Rent | $2,500 | 0.0% | -- |
| 01/23/2019 01/23/19 | Rented | $2,500 | -- | -- |
| Year | Tax Paid | Tax Assessment Tax Assessment Total Assessment is a certain percentage of the fair market value that is determined by local assessors to be the total taxable value of land and additions on the property. | Land | Improvement |
|---|---|---|---|---|
| 2025 | $15,360 | $796,973 | $207,749 | $589,224 |
| 2024 | $15,360 | $806,019 | $196,295 | $609,724 |
| 2023 | $15,360 | $775,000 | $178,718 | $596,282 |
| 2022 | $13,046 | $611,871 | $162,502 | $449,369 |
| 2021 | $12,453 | $551,346 | $162,502 | $388,844 |
| 2020 | $12,152 | $535,073 | $162,502 | $372,571 |
| 2019 | $15,797 | $668,557 | $188,920 | $479,637 |
| 2018 | $12,233 | $513,900 | $188,920 | $324,980 |
| 2017 | $3,824 | $162,500 | $162,500 | $0 |
| 2016 | $4,619 | $196,280 | $149,350 | $46,930 |
| 2015 | $3,870 | $184,820 | $122,810 | $62,010 |
| 2014 | $3,870 | $178,970 | $122,810 | $56,160 |
Seller's Agent in 2025
Maurey Bell
Bell Properties
(979) 218-1565
3 in this area
240 Total Sales
C
Buyer's Agent in 2025
Crystal Siegert
Bell Properties
(979) 255-9641
45 Total Sales
C
Buyer's Agent in 2024
Courtney Conley
Aggieland Properties
(936) 523-0931
3 Total Sales
C
Seller's Agent in 2022
Christina Young
Century 21 Integra Unlocked
Seller Co-Listing Agent in 2022
Chelsie Breaux
RE/MAX
(979) 255-8637
7 in this area
107 Total Sales
Seller Co-Listing Agent in 2019
Kayla Robison
Aggieland Properties
(936) 718-3529
29 Total Sales