Estimated Value: $197,000 - $202,000
3
Beds
2
Baths
1,460
Sq Ft
$136/Sq Ft
Est. Value
About This Home
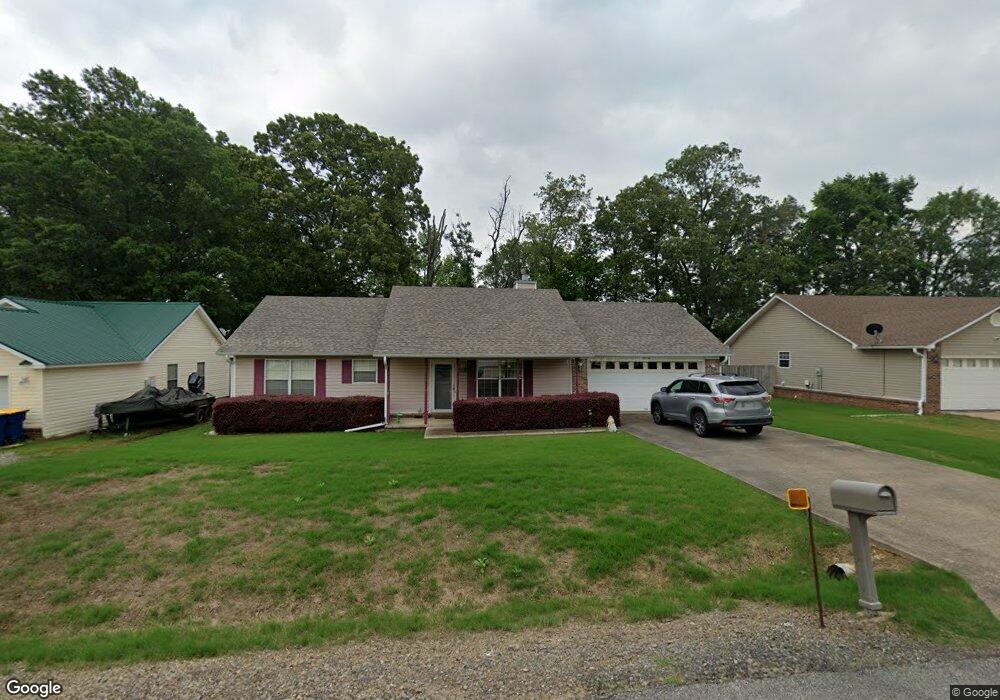
This home is located at 1014 Highland Blvd, Cabot, AR 72023 and is currently estimated at $198,688, approximately $136 per square foot. 1014 Highland Blvd is a home located in Lonoke County with nearby schools including Mountain Springs Elementary School, Cabot Middle School North, and Cabot Junior High North.
Ownership History
Date
Name
Owned For
Owner Type
Purchase Details
Closed on
May 15, 2018
Sold by
Charles F Rogers Lt
Bought by
Holcomb Betty R
Current Estimated Value
Home Financials for this Owner
Home Financials are based on the most recent Mortgage that was taken out on this home.
Original Mortgage
$104,400
Outstanding Balance
$88,987
Interest Rate
4.4%
Mortgage Type
New Conventional
Estimated Equity
$109,701
Purchase Details
Closed on
Sep 28, 2011
Sold by
Rogers Charles F and Rogers Ingeborg W
Bought by
Rogers Charles F and Best Karina Kay
Purchase Details
Closed on
Sep 21, 2011
Sold by
Rogers Charles F and Rogers Ingeborg W
Bought by
Rogers Charles F and Best Karina Kay
Purchase Details
Closed on
May 23, 1994
Bought by
Rogers and Wife Ingeborg
Purchase Details
Closed on
Jan 4, 1994
Bought by
Sunrise
Create a Home Valuation Report for This Property
The Home Valuation Report is an in-depth analysis detailing your home's value as well as a comparison with similar homes in the area
Purchase History
| Date | Buyer | Sale Price | Title Company |
|---|---|---|---|
| Holcomb Betty R | $116,000 | Lenders Title | |
| Rogers Charles F | -- | -- | |
| Rogers Charles F | -- | -- | |
| Rogers | $80,000 | -- | |
| Rogers | $80,000 | -- | |
| Sunrise | -- | -- |
Source: Public Records
Mortgage History
| Date | Status | Borrower | Loan Amount |
|---|---|---|---|
| Open | Holcomb Betty R | $104,400 |
Source: Public Records
Tax History Compared to Growth
Tax History
| Year | Tax Paid | Tax Assessment Tax Assessment Total Assessment is a certain percentage of the fair market value that is determined by local assessors to be the total taxable value of land and additions on the property. | Land | Improvement |
|---|---|---|---|---|
| 2025 | $627 | $22,560 | $3,000 | $19,560 |
| 2024 | $627 | $22,560 | $3,000 | $19,560 |
| 2023 | $627 | $22,560 | $3,000 | $19,560 |
| 2022 | $677 | $22,560 | $3,000 | $19,560 |
| 2021 | $677 | $22,560 | $3,000 | $19,560 |
| 2020 | $677 | $20,660 | $3,000 | $17,660 |
| 2019 | $677 | $20,660 | $3,000 | $17,660 |
| 2018 | $671 | $20,660 | $3,000 | $17,660 |
| 2017 | $948 | $20,660 | $3,000 | $17,660 |
| 2016 | $671 | $20,660 | $3,000 | $17,660 |
| 2015 | $1,008 | $21,970 | $3,000 | $18,970 |
| 2014 | $735 | $21,970 | $3,000 | $18,970 |
Source: Public Records
Map
Nearby Homes
- 1020 Highland Blvd
- 1017 Southhills Dr
- Lot 4 Knifechief Cove
- Lot 3 Knifechief Cove
- 30 Echohawk Ln
- Lot 13 Pawnee Dr
- 141 Birchwood Cir
- 138 Birchwood Cir
- 24 Crestwood Dr
- 2013 N Hills Dr
- 391 Briarwood Loop
- 8 Crestwood Cove
- 18 Glendale Dr
- 117 N A & B Park St
- 02 Bradford Dr
- 03A Bradford Dr
- 08 Bradford Dr
- 07 Bradford Dr
- 01 Bradford Dr
- 1074 Highland Blvd
- 1016 Highland Blvd
- 1012 Highland Blvd
- 1302 Willie Ray Dr
- 1015 Highland Blvd
- 1018 Highland Blvd
- 1017 Highland Blvd
- 0 Highland Blvd
- 1013 Highland Blvd
- 1010 Highland Blvd
- 1019 Highland Blvd
- 1011 Highland Blvd
- 1020 Southhills Dr
- 1020 S Hills Dr
- 1018 S Hills Dr
- 1018 Southhills Dr
- 0 South Hills Unit 15030496
- 0 Willie Ray Rd Unit 16017638
- 1022 Southhills Dr
- 1021 Highland Blvd
- 1022 S Hills