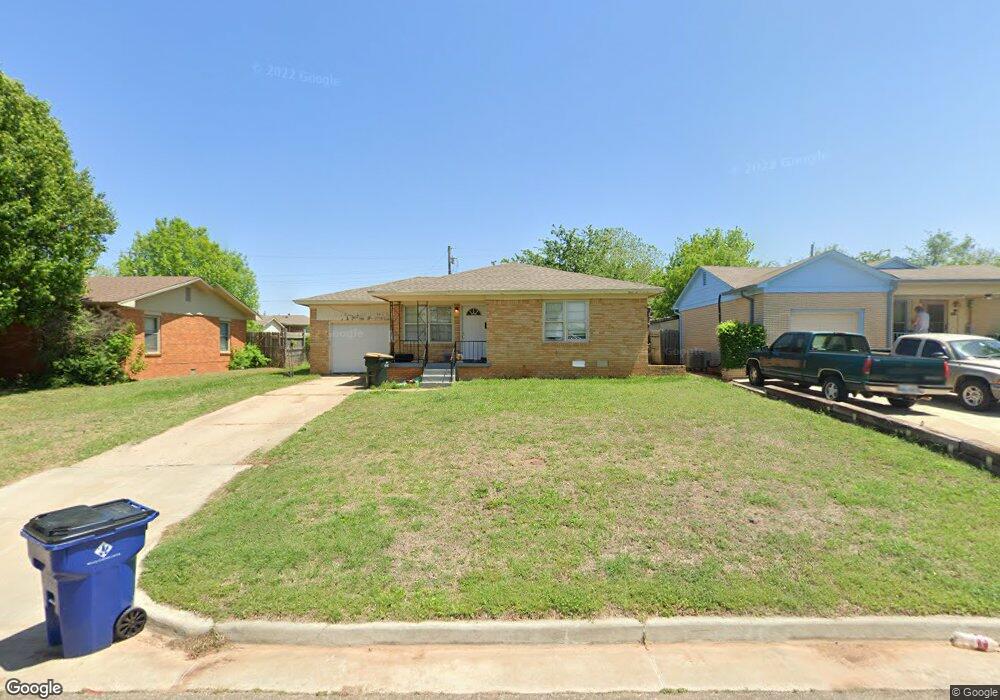
1014 N B St Duncan, OK 73533
Estimated Value: $59,000 - $66,000
3
Beds
1
Bath
1,032
Sq Ft
$59/Sq Ft
Est. Value
About This Home
This home is located at 1014 N B St, Duncan, OK 73533 and is currently estimated at $60,914, approximately $59 per square foot. 1014 N B St is a home located in Stephens County with nearby schools including Woodrow Wilson Elementary School, Duncan Middle School, and Duncan High School.
Ownership History
Date
Name
Owned For
Owner Type
Purchase Details
Closed on
May 17, 2024
Sold by
Johnson Alex and Johnson Chris
Bought by
Campbell Robert Leyton
Current Estimated Value
Home Financials for this Owner
Home Financials are based on the most recent Mortgage that was taken out on this home.
Original Mortgage
$41,250
Outstanding Balance
$40,634
Interest Rate
6.88%
Mortgage Type
New Conventional
Estimated Equity
$20,280
Purchase Details
Closed on
Apr 22, 1999
Sold by
Helen Bizzle J and Helen Sue
Bought by
Patterson Ralph L and Patterson Marilyn E
Create a Home Valuation Report for This Property
The Home Valuation Report is an in-depth analysis detailing your home's value as well as a comparison with similar homes in the area
Home Values in the Area
Average Home Value in this Area
Purchase History
| Date | Buyer | Sale Price | Title Company |
|---|---|---|---|
| Campbell Robert Leyton | $55,000 | First American Title | |
| Patterson Ralph L | $18,000 | -- |
Source: Public Records
Mortgage History
| Date | Status | Borrower | Loan Amount |
|---|---|---|---|
| Open | Campbell Robert Leyton | $41,250 |
Source: Public Records
Tax History Compared to Growth
Tax History
| Year | Tax Paid | Tax Assessment Tax Assessment Total Assessment is a certain percentage of the fair market value that is determined by local assessors to be the total taxable value of land and additions on the property. | Land | Improvement |
|---|---|---|---|---|
| 2025 | $533 | $6,311 | $405 | $5,906 |
| 2024 | $427 | $5,015 | $405 | $4,610 |
| 2023 | $427 | $5,015 | $405 | $4,610 |
| 2022 | $387 | $4,548 | $405 | $4,143 |
| 2021 | $387 | $4,552 | $405 | $4,147 |
| 2020 | $327 | $3,783 | $405 | $3,378 |
| 2019 | $312 | $3,603 | $405 | $3,198 |
| 2018 | $306 | $3,603 | $405 | $3,198 |
| 2017 | $281 | $3,431 | $405 | $3,026 |
| 2016 | $265 | $3,113 | $405 | $2,708 |
| 2015 | $233 | $2,964 | $405 | $2,559 |
| 2014 | $233 | $2,823 | $405 | $2,418 |
Source: Public Records
Map
Nearby Homes