Estimated Value: $259,000 - $290,000
--
Bed
3
Baths
2,154
Sq Ft
$128/Sq Ft
Est. Value
About This Home
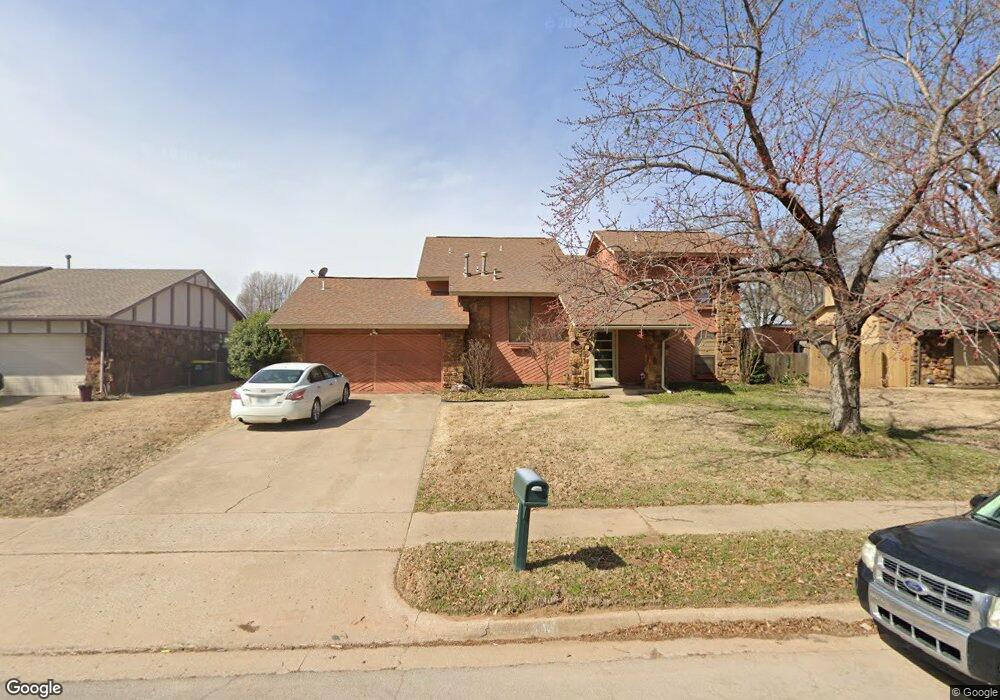
This home is located at 1014 N Juniper St, Jenks, OK 74037 and is currently estimated at $276,784, approximately $128 per square foot. 1014 N Juniper St is a home located in Tulsa County with nearby schools including Jenks West Elementary School, Jenks West Intermediate Elementary School, and Jenks Middle School.
Ownership History
Date
Name
Owned For
Owner Type
Purchase Details
Closed on
Sep 28, 2004
Sold by
Jones Kevin S and Jones Marleen C
Bought by
Wilson John F and Wilson Christina C
Current Estimated Value
Home Financials for this Owner
Home Financials are based on the most recent Mortgage that was taken out on this home.
Original Mortgage
$118,500
Outstanding Balance
$58,805
Interest Rate
5.8%
Mortgage Type
Purchase Money Mortgage
Estimated Equity
$217,979
Purchase Details
Closed on
Apr 7, 2000
Sold by
Ferrier Barbara A
Bought by
Jones Kevin S and Jones Marleen C
Purchase Details
Closed on
Apr 5, 2000
Sold by
Guardianship Of Stephen Gregory Ferrier
Bought by
Jones Kevin S and Jones Marleen C
Purchase Details
Closed on
Feb 22, 2000
Sold by
Guardianship Of Stephen Gregory Ferrier
Bought by
Ferrier Barbara Ann
Purchase Details
Closed on
Jun 1, 1989
Create a Home Valuation Report for This Property
The Home Valuation Report is an in-depth analysis detailing your home's value as well as a comparison with similar homes in the area
Home Values in the Area
Average Home Value in this Area
Purchase History
| Date | Buyer | Sale Price | Title Company |
|---|---|---|---|
| Wilson John F | $118,500 | -- | |
| Jones Kevin S | $55,000 | Tulsa Abstract & Title Co | |
| Jones Kevin S | $55,000 | Tulsa Abstract & Title Co | |
| Jones Kevin S | -- | Tulsa Abstract & Title Co | |
| Ferrier Barbara Ann | $55,000 | -- | |
| -- | $70,000 | -- |
Source: Public Records
Mortgage History
| Date | Status | Borrower | Loan Amount |
|---|---|---|---|
| Open | Wilson John F | $118,500 |
Source: Public Records
Tax History Compared to Growth
Tax History
| Year | Tax Paid | Tax Assessment Tax Assessment Total Assessment is a certain percentage of the fair market value that is determined by local assessors to be the total taxable value of land and additions on the property. | Land | Improvement |
|---|---|---|---|---|
| 2024 | $2,122 | $17,499 | $1,726 | $15,773 |
| 2023 | $2,122 | $16,666 | $1,795 | $14,871 |
| 2022 | $2,040 | $15,872 | $2,454 | $13,418 |
| 2021 | $1,968 | $15,116 | $2,337 | $12,779 |
| 2020 | $1,887 | $14,817 | $2,291 | $12,526 |
| 2019 | $1,809 | $14,111 | $2,182 | $11,929 |
| 2018 | $1,822 | $14,111 | $2,182 | $11,929 |
| 2017 | $1,738 | $13,686 | $2,116 | $11,570 |
| 2016 | $1,696 | $13,035 | $2,090 | $10,945 |
| 2015 | $1,728 | $13,035 | $2,090 | $10,945 |
| 2014 | $1,767 | $13,035 | $2,090 | $10,945 |
Source: Public Records
Map
Nearby Homes
- 927 W J St
- 1012 N Forest Place
- 422 N Forest St
- 9340 S Elwood Ave
- 9402 S Elwood
- 2102 W J St
- 2102 W F Ct
- 2105 W F Ct
- 108 W K Place
- 649 W 101st Place S
- 9726 S Houston Ave
- 508 N Willow St
- 0 W 101st Place S
- 2428 W C St
- 1 W 81st St
- 908 W 86th Place S
- 504 E B St Unit G
- 8730 S Olympia Ave
- 922 W 86th St S
- 912 W 85th St
- 930 N Juniper St
- 1020 N Juniper St
- 926 N Juniper St
- 1035 W K St
- 929 N Juniper St
- 920 N Juniper St
- 1027 W K St
- 925 N Juniper St
- 1028 W K St
- 919 N Juniper St
- 916 N Juniper St
- 1021 W K St
- 924 N Ivy Place
- 918 N Ivy Place
- 915 N Juniper St
- 912 N Juniper St
- 1015 W K St
- 914 N Ivy Place
- 927 N Ivy Place
- 911 N Juniper St