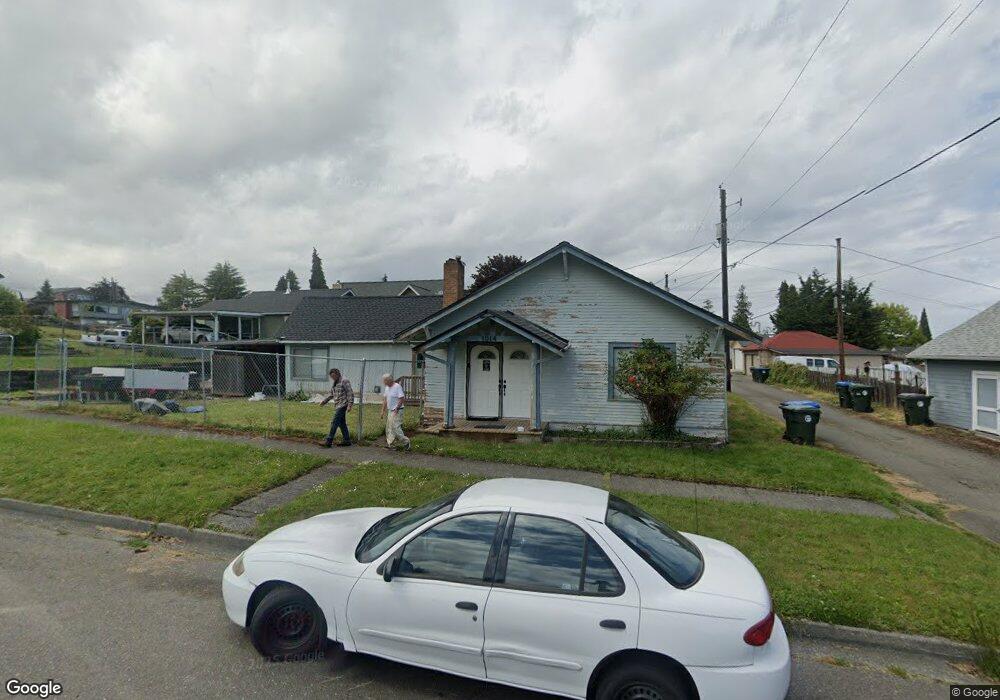
1014 S Chase St Port Angeles, WA 98362
Estimated Value: $335,987 - $415,000
3
Beds
2
Baths
1,502
Sq Ft
$244/Sq Ft
Est. Value
About This Home
This home is located at 1014 S Chase St, Port Angeles, WA 98362 and is currently estimated at $366,996, approximately $244 per square foot. 1014 S Chase St is a home located in Clallam County with nearby schools including Jefferson Elementary School, Stevens Middle School, and Port Angeles High School.
Ownership History
Date
Name
Owned For
Owner Type
Purchase Details
Closed on
Jul 14, 2021
Sold by
Anderson Monicka and Page Monicka
Bought by
Anderson Monicka and Anderson Jerid
Current Estimated Value
Purchase Details
Closed on
May 20, 2008
Sold by
Treakle John W and Treakle Betty N
Bought by
Page Monicka and Kitchens Dennis
Home Financials for this Owner
Home Financials are based on the most recent Mortgage that was taken out on this home.
Original Mortgage
$167,950
Outstanding Balance
$74,526
Interest Rate
6.04%
Mortgage Type
New Conventional
Estimated Equity
$292,470
Create a Home Valuation Report for This Property
The Home Valuation Report is an in-depth analysis detailing your home's value as well as a comparison with similar homes in the area
Home Values in the Area
Average Home Value in this Area
Purchase History
| Date | Buyer | Sale Price | Title Company |
|---|---|---|---|
| Anderson Monicka | -- | None Available | |
| Page Monicka | $165,000 | Olympic Peninsula Title Co |
Source: Public Records
Mortgage History
| Date | Status | Borrower | Loan Amount |
|---|---|---|---|
| Open | Page Monicka | $167,950 |
Source: Public Records
Tax History Compared to Growth
Tax History
| Year | Tax Paid | Tax Assessment Tax Assessment Total Assessment is a certain percentage of the fair market value that is determined by local assessors to be the total taxable value of land and additions on the property. | Land | Improvement |
|---|---|---|---|---|
| 2021 | $2,354 | $183,690 | $50,000 | $133,690 |
| 2020 | $1,891 | $176,834 | $50,000 | $126,834 |
| 2018 | $1,959 | $166,499 | $50,000 | $116,499 |
| 2017 | $1,648 | $139,781 | $50,000 | $89,781 |
| 2016 | $1,648 | $140,501 | $50,000 | $90,501 |
| 2015 | $1,648 | $129,809 | $50,000 | $79,809 |
| 2013 | $1,648 | $126,193 | $50,000 | $76,193 |
| 2012 | $1,648 | $141,160 | $53,125 | $88,035 |
Source: Public Records
Map
Nearby Homes