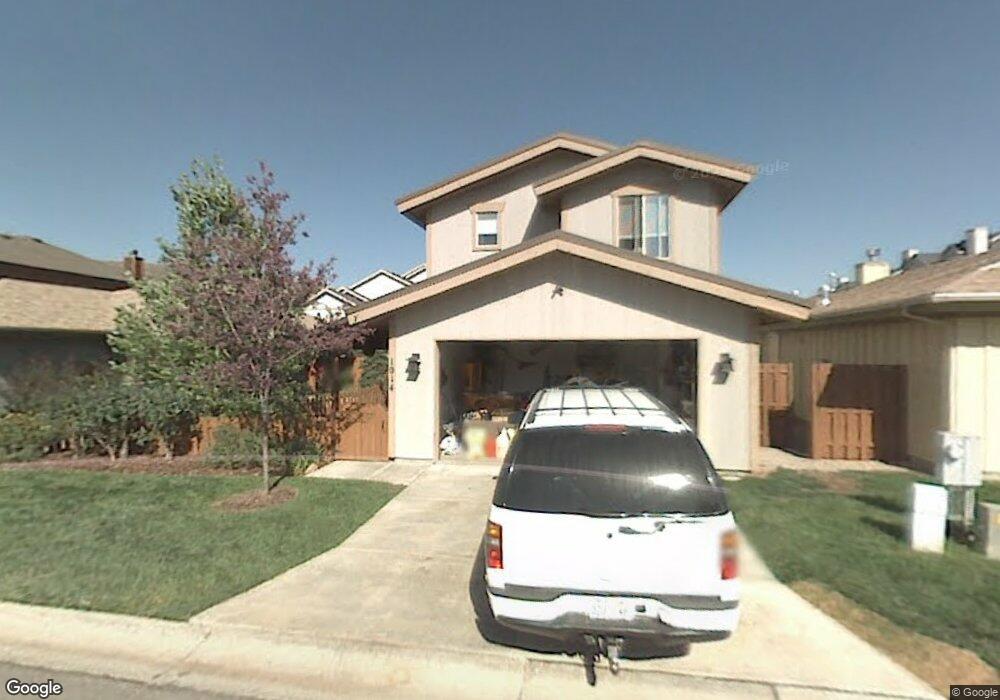
1014 Station Loop Rd Park City, UT 84098
Estimated Value: $998,097 - $1,204,000
2
Beds
3
Baths
1,508
Sq Ft
$752/Sq Ft
Est. Value
About This Home
This home is located at 1014 Station Loop Rd, Park City, UT 84098 and is currently estimated at $1,134,024, approximately $752 per square foot. 1014 Station Loop Rd is a home located in Summit County with nearby schools including Trailside School, Ecker Hill Middle School, and Treasure Mountain Junior High School.
Ownership History
Date
Name
Owned For
Owner Type
Purchase Details
Closed on
Oct 13, 2010
Sold by
Hsbc Bank Usa Na
Bought by
Handly Briar J
Current Estimated Value
Home Financials for this Owner
Home Financials are based on the most recent Mortgage that was taken out on this home.
Original Mortgage
$275,000
Interest Rate
4.25%
Mortgage Type
FHA
Purchase Details
Closed on
Jun 8, 2010
Sold by
Pivo Kelly R
Bought by
Hsbc Bank Usa N A
Purchase Details
Closed on
Sep 27, 2006
Sold by
Swoyer Leo A
Bought by
Piyo Kelly A
Home Financials for this Owner
Home Financials are based on the most recent Mortgage that was taken out on this home.
Original Mortgage
$345,600
Interest Rate
6.62%
Mortgage Type
Adjustable Rate Mortgage/ARM
Purchase Details
Closed on
Mar 31, 2006
Sold by
Swoyer Leo A
Bought by
Swoyer Leo A
Create a Home Valuation Report for This Property
The Home Valuation Report is an in-depth analysis detailing your home's value as well as a comparison with similar homes in the area
Home Values in the Area
Average Home Value in this Area
Purchase History
| Date | Buyer | Sale Price | Title Company |
|---|---|---|---|
| Handly Briar J | -- | -- | |
| Hsbc Bank Usa N A | $310,000 | -- | |
| Piyo Kelly A | -- | None Available | |
| Swoyer Leo A | -- | Equity Title |
Source: Public Records
Mortgage History
| Date | Status | Borrower | Loan Amount |
|---|---|---|---|
| Previous Owner | Handly Briar J | $275,000 | |
| Previous Owner | Piyo Kelly A | $345,600 |
Source: Public Records
Tax History
| Year | Tax Paid | Tax Assessment Tax Assessment Total Assessment is a certain percentage of the fair market value that is determined by local assessors to be the total taxable value of land and additions on the property. | Land | Improvement |
|---|---|---|---|---|
| 2025 | $3,328 | $562,790 | $136,125 | $426,665 |
| 2024 | $3,459 | $604,362 | $123,750 | $480,612 |
| 2023 | $3,459 | $604,362 | $123,750 | $480,612 |
| 2022 | $2,875 | $444,158 | $123,750 | $320,408 |
| 2021 | $2,635 | $353,668 | $55,688 | $297,980 |
| 2020 | $2,472 | $282,459 | $55,688 | $226,771 |
| 2019 | $2,334 | $282,459 | $55,688 | $226,771 |
| 2018 | $2,334 | $282,459 | $55,688 | $226,771 |
| 2017 | $2,170 | $282,459 | $55,688 | $226,771 |
| 2016 | $1,908 | $230,920 | $55,688 | $175,232 |
| 2015 | $2,022 | $230,920 | $0 | $0 |
| 2013 | $1,667 | $179,381 | $0 | $0 |
Source: Public Records
Map
Nearby Homes
- 900 W Bitner Rd Unit M22
- 1107 Station Loop Rd
- 8151 Bitner Rd
- 900 Bitner Rd Unit D 34
- 900 Bitner Rd Unit M22
- 900 Bitner Rd Unit B37
- 900 Bitner Rd Unit G21
- 900 Bitner Rd Unit C24
- 900 Bitner Rd Unit C24
- 900 Bitner Rd Unit K 21
- 900 Bitner Rd Unit M17
- 1031 Station Loop Rd
- 1041 Lincoln Ln
- 1141 Station Loop Rd
- 1339 Fiddich Glen Ln
- 1370 Center Dr Unit 17
- 1456 Newpark Blvd Unit 417
- 1456 Newpark Blvd Unit 213
- 6169 Park Ln S Unit 10
- 6169 Park Ln S Unit 9
- 1016 Station Loop Rd
- 1016 Station Loop Rd Unit 82
- 1018 Station Loop Rd
- 1008 Station Loop Rd
- 1020 Station Loop Rd
- 1006 Station Loop Rd
- 1100 Station Loop Rd
- 1022 Station Loop Rd
- 1004 Station Loop Rd
- 1101 Station Loop Rd
- 1103 Station Loop Rd
- 1024 Station Loop Rd
- 1025 Station Loop Rd
- 1025 Station Loop Rd Unit 146
- 1105 Station Loop Rd
- 1104 Station Loop Rd
- 1002 Station Loop Rd
- 1002 Station Loop Rd Unit 75
- 1026 Station Loop Rd
- 1027 Station Loop Rd
Your Personal Tour Guide
Ask me questions while you tour the home.