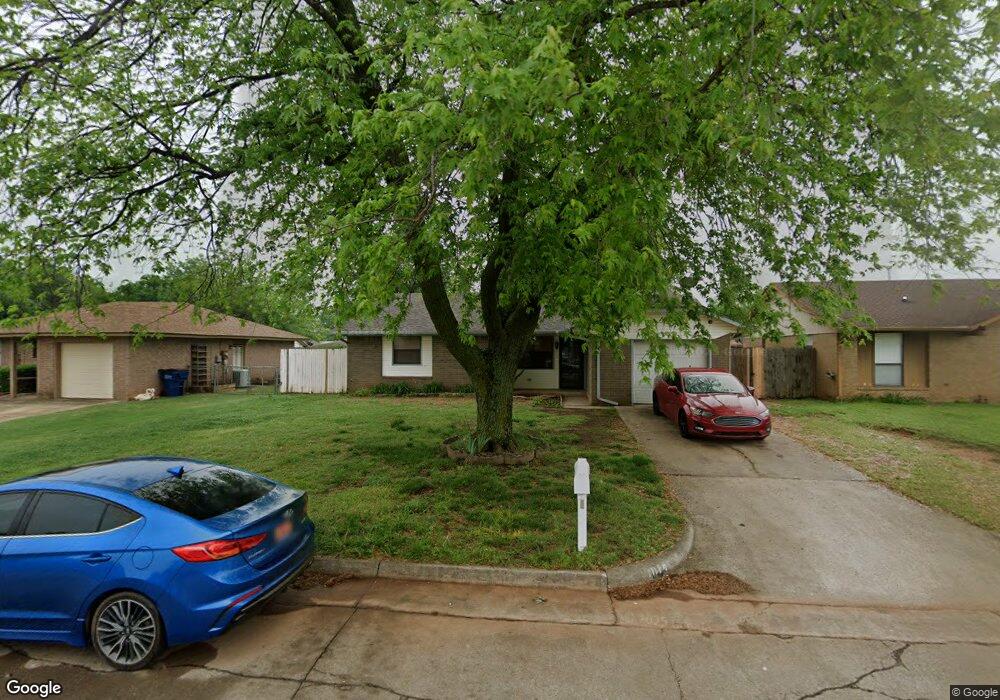
1014 W Griggs Way Mustang, OK 73064
Estimated Value: $146,000 - $172,000
3
Beds
2
Baths
993
Sq Ft
$155/Sq Ft
Est. Value
About This Home
This home is located at 1014 W Griggs Way, Mustang, OK 73064 and is currently estimated at $153,800, approximately $154 per square foot. 1014 W Griggs Way is a home located in Canadian County with nearby schools including Mustang Lakehoma Elementary School, Mustang Horizon Intermediate School, and Mustang Middle School.
Ownership History
Date
Name
Owned For
Owner Type
Purchase Details
Closed on
Apr 14, 2015
Sold by
Strong Stefanie Marie and Strong Robert J
Bought by
Holman Mason Dane and Adams Jessica L
Current Estimated Value
Home Financials for this Owner
Home Financials are based on the most recent Mortgage that was taken out on this home.
Original Mortgage
$91,805
Outstanding Balance
$71,006
Interest Rate
3.87%
Mortgage Type
FHA
Estimated Equity
$82,794
Purchase Details
Closed on
May 20, 2011
Sold by
Niblett Tracie R
Bought by
Strong Stefanie Marie and Strong Robert J
Home Financials for this Owner
Home Financials are based on the most recent Mortgage that was taken out on this home.
Original Mortgage
$85,281
Interest Rate
5.5%
Mortgage Type
FHA
Purchase Details
Closed on
Jun 25, 1999
Sold by
Wettlaufer Donna J and Wettlaufer Douglas K
Purchase Details
Closed on
May 1, 1995
Sold by
Baker Randall Scott and Baker C
Create a Home Valuation Report for This Property
The Home Valuation Report is an in-depth analysis detailing your home's value as well as a comparison with similar homes in the area
Home Values in the Area
Average Home Value in this Area
Purchase History
| Date | Buyer | Sale Price | Title Company |
|---|---|---|---|
| Holman Mason Dane | $93,500 | Old Republic Title | |
| Strong Stefanie Marie | $87,500 | Ort | |
| -- | $57,000 | -- | |
| -- | $45,000 | -- |
Source: Public Records
Mortgage History
| Date | Status | Borrower | Loan Amount |
|---|---|---|---|
| Open | Holman Mason Dane | $91,805 | |
| Previous Owner | Strong Stefanie Marie | $85,281 |
Source: Public Records
Tax History Compared to Growth
Tax History
| Year | Tax Paid | Tax Assessment Tax Assessment Total Assessment is a certain percentage of the fair market value that is determined by local assessors to be the total taxable value of land and additions on the property. | Land | Improvement |
|---|---|---|---|---|
| 2024 | $1,084 | $11,410 | $1,620 | $9,790 |
| 2023 | $1,084 | $10,867 | $1,620 | $9,247 |
| 2022 | $1,045 | $10,349 | $1,620 | $8,729 |
| 2021 | $999 | $9,856 | $1,620 | $8,236 |
| 2020 | $957 | $9,387 | $1,620 | $7,767 |
| 2019 | $936 | $9,171 | $1,620 | $7,551 |
| 2018 | $994 | $9,533 | $1,620 | $7,913 |
| 2017 | $952 | $9,237 | $1,620 | $7,617 |
| 2016 | $932 | $9,026 | $1,620 | $7,406 |
| 2015 | $1,130 | $8,606 | $1,620 | $6,986 |
| 2014 | $1,130 | $10,878 | $1,200 | $9,678 |
Source: Public Records
Map
Nearby Homes
- 1035 W Windsor Way
- 608 N Remington Way
- 508 N Caddell Way
- 1005 W Ridgehaven Way
- 513 N Shannon Way
- 313 N Shannon Way
- 601 N Chisholm Trail Way
- 1208 W Flowering Peach Way
- 1308 W Harvard Way
- 900 W Nandina Way
- 1316 W Harvard Way
- 400 N Amethyst Way
- 1250 N Tea Olive Way
- 1401 W Harvard Way
- 401 N Topaz Way
- 1408 N Golden Bell Way
- 628 W Alamo Court Way
- 309 N Topaz Way
- 913 N Centennial Way
- 609 N Centennial Way
- 1010 W Griggs Way
- 1018 W Griggs Way
- 1006 W Griggs Way
- 1022 W Griggs Way
- 1025 W Johnathan Way
- 1025 W Johnathan Way
- 1025 W Johnathan Way
- 1025 W Johnathan Way
- 1019 W Johnathan Way
- 1017 W Griggs Way
- 1013 W Johnathan Way
- 1013 W Griggs Way
- 617 N Holli Way
- 1002 W Griggs Way
- 1026 W Griggs Way
- 1007 W Johnathan Way
- 1031 W Johnathan Way
- 1021 W Griggs Way
- 621 N Holli Way
- 1035 W Johnathan Way