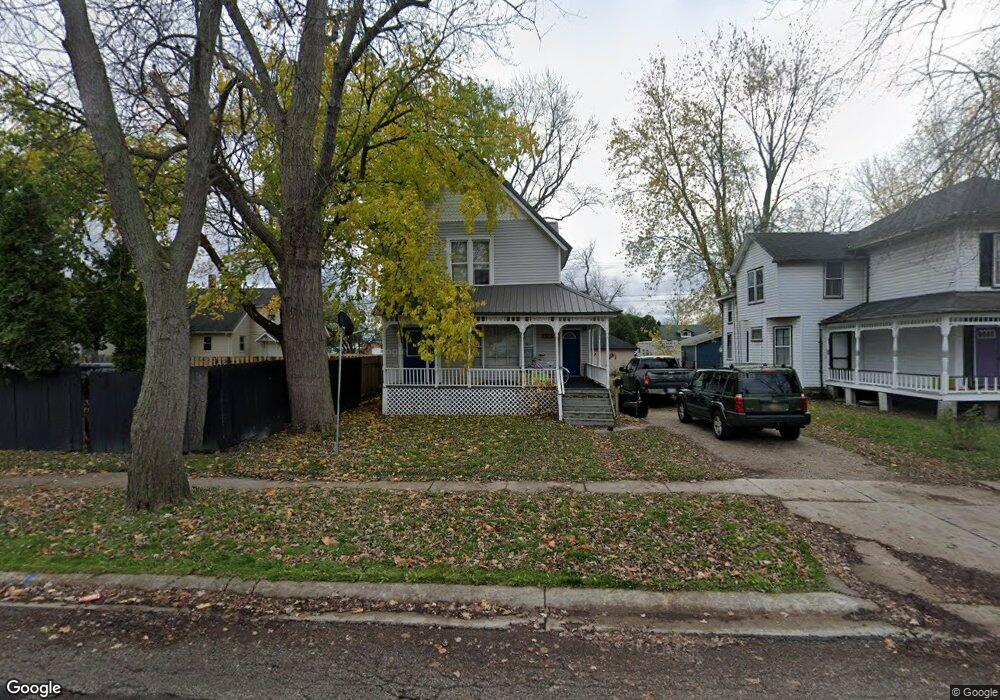
1014 Wall St Port Huron, MI 48060
Estimated Value: $119,000 - $158,000
3
Beds
2
Baths
2,000
Sq Ft
$67/Sq Ft
Est. Value
About This Home
This home is located at 1014 Wall St, Port Huron, MI 48060 and is currently estimated at $133,969, approximately $66 per square foot. 1014 Wall St is a home located in St. Clair County with nearby schools including Woodrow Wilson Elementary School, Central Middle School, and Port Huron High School.
Ownership History
Date
Name
Owned For
Owner Type
Purchase Details
Closed on
Jul 8, 2011
Sold by
Stapleton Jeffrey and Stapleton Carrie
Bought by
Sochor Harold E
Current Estimated Value
Purchase Details
Closed on
Jun 27, 2006
Sold by
Robinson Donald W and Robinson Renee
Bought by
Stapleton Jeffrey and Stapleton Carrie
Home Financials for this Owner
Home Financials are based on the most recent Mortgage that was taken out on this home.
Original Mortgage
$94,500
Interest Rate
6.73%
Mortgage Type
New Conventional
Create a Home Valuation Report for This Property
The Home Valuation Report is an in-depth analysis detailing your home's value as well as a comparison with similar homes in the area
Home Values in the Area
Average Home Value in this Area
Purchase History
| Date | Buyer | Sale Price | Title Company |
|---|---|---|---|
| Sochor Harold E | $11,900 | The Title Agency Of Michigan | |
| Stapleton Jeffrey | $97,000 | None Available |
Source: Public Records
Mortgage History
| Date | Status | Borrower | Loan Amount |
|---|---|---|---|
| Previous Owner | Stapleton Jeffrey | $94,500 |
Source: Public Records
Tax History
| Year | Tax Paid | Tax Assessment Tax Assessment Total Assessment is a certain percentage of the fair market value that is determined by local assessors to be the total taxable value of land and additions on the property. | Land | Improvement |
|---|---|---|---|---|
| 2025 | $2,760 | $61,900 | $0 | $0 |
| 2024 | $2,797 | $58,600 | $0 | $0 |
| 2023 | $2,545 | $52,300 | $0 | $0 |
| 2022 | $2,594 | $43,700 | $0 | $0 |
| 2020 | $1,929 | $39,800 | $39,800 | $0 |
| 2019 | $1,835 | $30,200 | $0 | $0 |
| 2018 | $1,794 | $30,200 | $0 | $0 |
| 2017 | $1,646 | $29,000 | $0 | $0 |
| 2016 | $1,465 | $29,000 | $0 | $0 |
| 2015 | $1,438 | $28,300 | $28,300 | $0 |
| 2014 | $1,438 | $26,700 | $26,700 | $0 |
| 2013 | -- | $26,700 | $0 | $0 |
Source: Public Records
Map
Nearby Homes