Estimated Value: $227,242 - $285,000
3
Beds
2
Baths
1,700
Sq Ft
$152/Sq Ft
Est. Value
About This Home
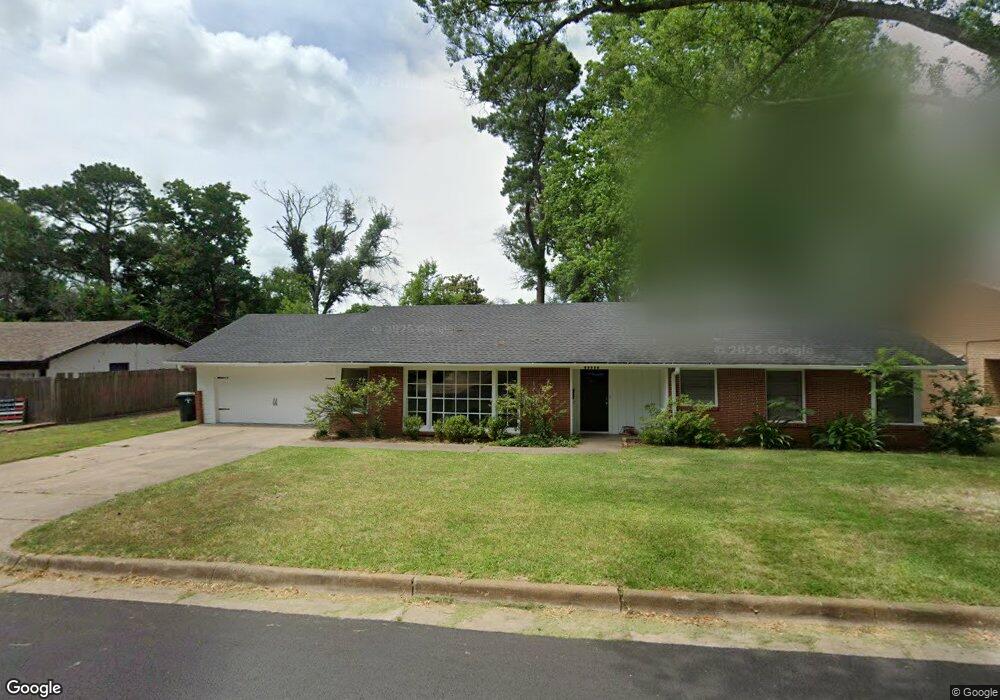
This home is located at 1014 Wilma St, Tyler, TX 75701 and is currently estimated at $258,561, approximately $152 per square foot. 1014 Wilma St is a home located in Smith County with nearby schools including Woods Elementary School, Hubbard Middle School, and Tyler Legacy High School.
Ownership History
Date
Name
Owned For
Owner Type
Purchase Details
Closed on
Aug 29, 2014
Sold by
Montgomery Paul D
Bought by
Montgomery Rental Properties Llc
Current Estimated Value
Home Financials for this Owner
Home Financials are based on the most recent Mortgage that was taken out on this home.
Original Mortgage
$80,000
Outstanding Balance
$25,382
Interest Rate
4.15%
Mortgage Type
Future Advance Clause Open End Mortgage
Estimated Equity
$233,179
Purchase Details
Closed on
Jan 16, 2008
Sold by
Hud
Bought by
Montgomery Paul D
Home Financials for this Owner
Home Financials are based on the most recent Mortgage that was taken out on this home.
Original Mortgage
$77,400
Interest Rate
5.94%
Mortgage Type
Purchase Money Mortgage
Purchase Details
Closed on
Sep 12, 2005
Sold by
Tapia Eugene A and Tapia Liliana A
Bought by
Mid America Mortgage Inc
Create a Home Valuation Report for This Property
The Home Valuation Report is an in-depth analysis detailing your home's value as well as a comparison with similar homes in the area
Home Values in the Area
Average Home Value in this Area
Purchase History
| Date | Buyer | Sale Price | Title Company |
|---|---|---|---|
| Montgomery Rental Properties Llc | -- | None Available | |
| Montgomery Paul D | -- | None Available | |
| Montgomery Paul D | -- | None Available | |
| Mid America Mortgage Inc | $96,482 | None Available | |
| Mid America Mortgage Inc | $96,482 | None Available |
Source: Public Records
Mortgage History
| Date | Status | Borrower | Loan Amount |
|---|---|---|---|
| Open | Montgomery Rental Properties Llc | $80,000 | |
| Previous Owner | Montgomery Paul D | $77,400 |
Source: Public Records
Tax History Compared to Growth
Tax History
| Year | Tax Paid | Tax Assessment Tax Assessment Total Assessment is a certain percentage of the fair market value that is determined by local assessors to be the total taxable value of land and additions on the property. | Land | Improvement |
|---|---|---|---|---|
| 2025 | $3,834 | $239,879 | $43,620 | $196,259 |
| 2024 | $3,834 | $225,369 | $26,205 | $199,164 |
| 2023 | $3,418 | $196,073 | $26,205 | $169,868 |
| 2022 | $3,457 | $176,442 | $24,458 | $151,984 |
| 2021 | $2,924 | $139,355 | $24,458 | $114,897 |
| 2020 | $3,033 | $141,725 | $24,458 | $117,267 |
| 2019 | $2,679 | $122,526 | $17,470 | $105,056 |
| 2018 | $2,532 | $116,395 | $17,470 | $98,925 |
| 2017 | $2,485 | $116,395 | $17,470 | $98,925 |
| 2016 | $2,426 | $113,655 | $17,470 | $96,185 |
| 2015 | $2,392 | $116,171 | $17,470 | $98,701 |
| 2014 | $2,392 | $112,579 | $17,470 | $95,109 |
Source: Public Records
Map
Nearby Homes
- 1102 S Peach Ave S
- 515 & 517 Charnwood St
- 3922 & 3928 McDonald Rd
- 2521 Pounds Ave
- 904 E Dulse St
- 2431 Homestead Ln
- 2425 Dietz Ln
- 2438 Dietz Ln
- 2413 Dietz Ln
- 2410 Dietz Ln
- 905 E Watkins St
- 2315 Homestead Ln
- 2322 Dietz Ln
- 2313 Dietz Ln
- 2319 Pollard Dr
- 1024 Clyde Dr
- 2215 Homestead Ln
- 2210 Homestead Ln
- 1101 Clyde Dr
- 3006 de Charles St
- 1006 Wilma St
- 1020 1020 Wilma St
- 1020 Wilma St
- 1015 Rhodes Dr
- 1023 Rhodes Dr
- 1023 1023 Rhodes
- 1013 Wilma St
- 1011 Rhodes Dr
- 1011 1011 Rhodes Dr
- 1000 Wilma St
- 1001 Wilma St
- 1023 Wilma St
- 2616 Pounds Ave
- 925 Rhodes Dr
- 918 Wilma St
- 1104 Wilma St
- 1010 E Barbara St
- 2531 Pounds Ave
- 1016 Rhodes Dr
- 1002 E Barbara St