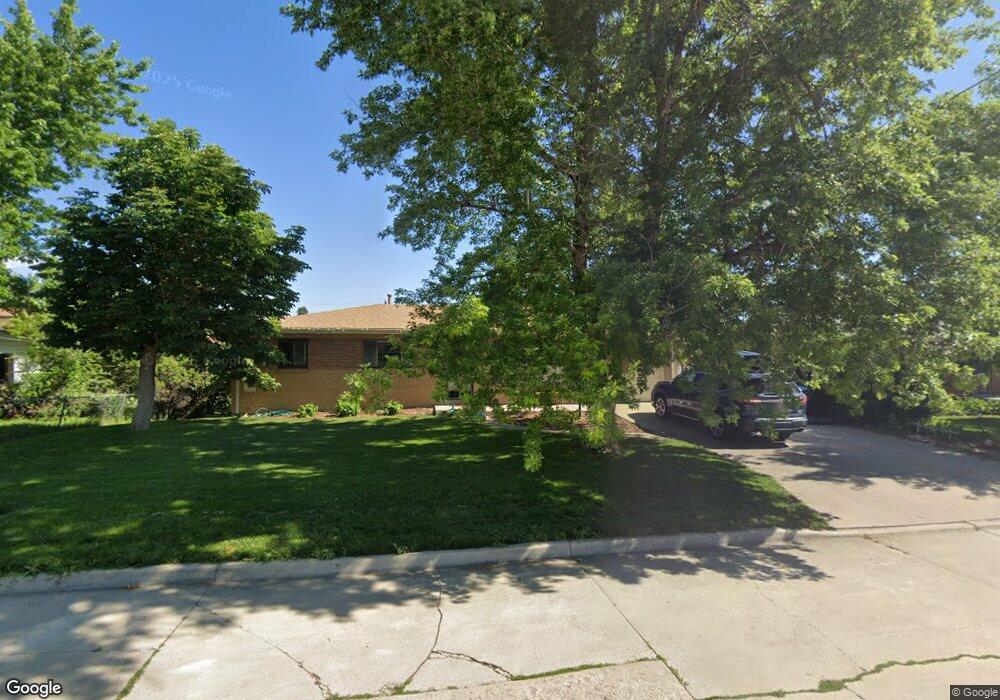
10145 W 19th Ave Denver, CO 80215
Applewood Valley NeighborhoodEstimated Value: $590,000 - $658,671
4
Beds
2
Baths
2,240
Sq Ft
$282/Sq Ft
Est. Value
About This Home
This home is located at 10145 W 19th Ave, Denver, CO 80215 and is currently estimated at $630,918, approximately $281 per square foot. 10145 W 19th Ave is a home located in Jefferson County with nearby schools including Lovelia P. Flournoy Elementary School, Stober Elementary School, and Everitt Middle School.
Ownership History
Date
Name
Owned For
Owner Type
Purchase Details
Closed on
Jun 22, 2016
Sold by
The Bauman Living Trust
Bought by
Howell Joseph P
Current Estimated Value
Home Financials for this Owner
Home Financials are based on the most recent Mortgage that was taken out on this home.
Original Mortgage
$325,920
Outstanding Balance
$259,481
Interest Rate
3.58%
Mortgage Type
New Conventional
Estimated Equity
$371,437
Purchase Details
Closed on
Jun 9, 2011
Sold by
Bauman Bradley E and Bauman Elaine M
Bought by
The Bauman Living Trut and Bauman Bradley A
Home Financials for this Owner
Home Financials are based on the most recent Mortgage that was taken out on this home.
Original Mortgage
$135,000
Interest Rate
4.7%
Mortgage Type
New Conventional
Purchase Details
Closed on
Mar 15, 2010
Sold by
Bauman Bradley E and Bauman Elaine M
Bought by
Bauman Bradley E and Bauman Elaine M
Create a Home Valuation Report for This Property
The Home Valuation Report is an in-depth analysis detailing your home's value as well as a comparison with similar homes in the area
Home Values in the Area
Average Home Value in this Area
Purchase History
| Date | Buyer | Sale Price | Title Company |
|---|---|---|---|
| Howell Joseph P | $340,000 | Homestead Title & Escrow | |
| The Bauman Living Trut | -- | Ccts | |
| Bauman Bradley E | -- | None Available |
Source: Public Records
Mortgage History
| Date | Status | Borrower | Loan Amount |
|---|---|---|---|
| Open | Howell Joseph P | $325,920 | |
| Previous Owner | The Bauman Living Trut | $135,000 |
Source: Public Records
Tax History Compared to Growth
Tax History
| Year | Tax Paid | Tax Assessment Tax Assessment Total Assessment is a certain percentage of the fair market value that is determined by local assessors to be the total taxable value of land and additions on the property. | Land | Improvement |
|---|---|---|---|---|
| 2024 | $3,104 | $34,419 | $17,505 | $16,914 |
| 2023 | $3,104 | $34,419 | $17,505 | $16,914 |
| 2022 | $2,796 | $30,313 | $17,949 | $12,364 |
| 2021 | $2,837 | $31,186 | $18,466 | $12,720 |
| 2020 | $2,647 | $29,229 | $17,425 | $11,804 |
| 2019 | $2,613 | $29,229 | $17,425 | $11,804 |
| 2018 | $2,374 | $25,690 | $11,195 | $14,495 |
| 2017 | $2,087 | $25,690 | $11,195 | $14,495 |
| 2016 | $1,817 | $20,873 | $6,720 | $14,153 |
| 2015 | $1,532 | $20,873 | $6,720 | $14,153 |
| 2014 | $1,532 | $16,127 | $5,731 | $10,396 |
Source: Public Records
Map
Nearby Homes
- 2005 Nelson St
- 10560 W 23rd Place
- 2450 Miller St
- 2451 Kipling St Unit 214
- 2451 Kipling St Unit 201
- 2490 Lewis St
- 11133 W 17th Ave Unit 105
- 10185 W 25th Ave Unit 29
- 2555 Lewis Ct
- 2060 Hoyt St
- 2580 Hoyt St
- 1390 Lewis St
- 1350 Lewis St
- 10445 W 13th Place
- 11217 W 18th Ave Unit A
- 2055 Quail Dr
- 30 Hillside Dr
- 10040 W 13th Place
- 16 Lakewood Heights Dr
- 1991 Glen Garry Dr
- 10155 W 19th Ave
- 10125 W 19th Ave
- 10140 W 20th Ave
- 10105 W 19th Ave
- 10130 W 19th Ave
- 10120 W 20th Ave
- 10120 W 19th Ave
- 1901 Lewis Ct
- 1830 Lee St
- 10085 W 19th Ave
- 10100 W 19th Ave
- 1870 Lewis Ct
- 10110 W 20th Ave
- 10050 W 19th Ave
- 1820 Lee St
- 2000 Lee St
- 1903 Lewis Ct
- 10065 W 19th Ave
- 2005 Lee St
- 2001 Kline St