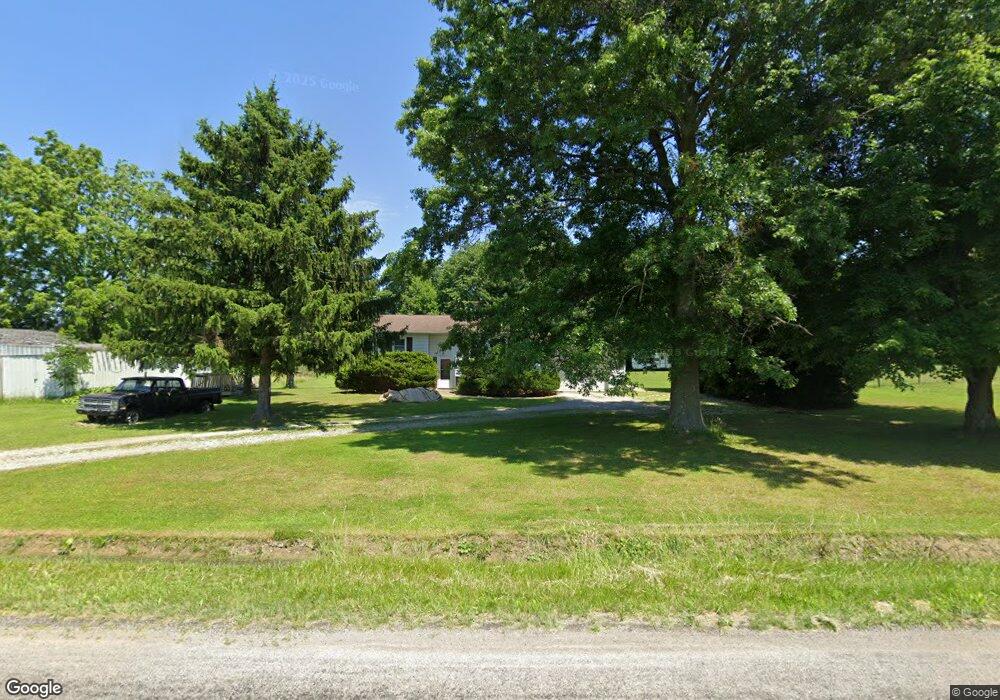
10147 Wohlgamuth Rd West Salem, OH 44287
Estimated Value: $168,000 - $198,000
2
Beds
1
Bath
1,100
Sq Ft
$172/Sq Ft
Est. Value
About This Home
This home is located at 10147 Wohlgamuth Rd, West Salem, OH 44287 and is currently estimated at $189,641, approximately $172 per square foot. 10147 Wohlgamuth Rd is a home located in Wayne County with nearby schools including Northwestern Elementary School, Northwestern Middle School, and West Salem Christian Educators.
Ownership History
Date
Name
Owned For
Owner Type
Purchase Details
Closed on
Aug 1, 2011
Sold by
Gilbert Delon L
Bought by
Meek Charles A and Pitts Lindsey M
Current Estimated Value
Home Financials for this Owner
Home Financials are based on the most recent Mortgage that was taken out on this home.
Original Mortgage
$102,070
Outstanding Balance
$70,540
Interest Rate
4.53%
Mortgage Type
New Conventional
Estimated Equity
$119,101
Purchase Details
Closed on
Sep 27, 2007
Sold by
Sigler Danie W and Sigler Kathy J
Bought by
Gilbert Delon L
Home Financials for this Owner
Home Financials are based on the most recent Mortgage that was taken out on this home.
Original Mortgage
$96,250
Interest Rate
6.66%
Mortgage Type
Unknown
Purchase Details
Closed on
Aug 14, 2002
Sold by
Shrf Harold Mcelfresh Pr
Bought by
Sigler Daniel W and Sigler Kathy J
Purchase Details
Closed on
Apr 30, 1987
Bought by
Mcelfresh Harold Edward
Create a Home Valuation Report for This Property
The Home Valuation Report is an in-depth analysis detailing your home's value as well as a comparison with similar homes in the area
Home Values in the Area
Average Home Value in this Area
Purchase History
| Date | Buyer | Sale Price | Title Company |
|---|---|---|---|
| Meek Charles A | $98,500 | Title Direct Ltd | |
| Gilbert Delon L | $96,300 | Wayne County Title Agency | |
| Sigler Daniel W | $58,000 | -- | |
| Mcelfresh Harold Edward | $48,500 | -- |
Source: Public Records
Mortgage History
| Date | Status | Borrower | Loan Amount |
|---|---|---|---|
| Open | Meek Charles A | $102,070 | |
| Closed | Gilbert Delon L | $96,250 |
Source: Public Records
Tax History Compared to Growth
Tax History
| Year | Tax Paid | Tax Assessment Tax Assessment Total Assessment is a certain percentage of the fair market value that is determined by local assessors to be the total taxable value of land and additions on the property. | Land | Improvement |
|---|---|---|---|---|
| 2024 | $2,071 | $51,610 | $12,030 | $39,580 |
| 2023 | $2,071 | $51,610 | $12,030 | $39,580 |
| 2022 | $1,903 | $43,000 | $10,020 | $32,980 |
| 2021 | $1,855 | $43,000 | $10,020 | $32,980 |
| 2020 | $1,875 | $43,000 | $10,020 | $32,980 |
| 2019 | $1,539 | $33,030 | $8,680 | $24,350 |
| 2018 | $1,513 | $33,030 | $8,680 | $24,350 |
| 2017 | $1,502 | $33,030 | $8,680 | $24,350 |
| 2016 | $1,422 | $31,760 | $8,350 | $23,410 |
| 2015 | $1,357 | $31,760 | $8,350 | $23,410 |
| 2014 | $1,372 | $31,760 | $8,350 | $23,410 |
| 2013 | $1,353 | $30,220 | $8,170 | $22,050 |
Source: Public Records
Map
Nearby Homes
- 104 N Maple St
- 11827 Stratton Rd
- 0 Congress Unit 5159386
- 0 Congress Unit 5150334
- 7789 Cedar Valley Rd
- 17 Andrew Ct
- 10212 Lattasburg Rd
- 58 State Route 42
- 80 S Lincoln St
- 999 Township Road 133
- V/L #10 Rice Hill Rd
- V/L #8 Rice Hill Rd
- V/L #9 Rice Hill Rd
- V/L #7 Rice Hill Rd
- V/L #13 Rice Hill Rd
- V/L #6 Rice Hill Rd
- V/L #5 Rice Hill Rd
- V/L #2 Rice Hill Rd
- V/L #11 Rice Hill Rd
- V/L #4 Rice Hill Rd
- 10175 Wohlgamuth Rd
- 10109 Wohlgamuth Rd
- 10065 Wohlgamuth Rd
- 8314 W Easton Rd
- 10322 Wohlgamuth Rd
- 8228 W Easton Rd
- 8202 W Easton Rd
- 8545 W Easton Rd
- 9979 Wohlgamuth Rd
- 8178 W Easton Rd
- 9915 Wohlgamuth Rd
- 8146 W Easton Rd
- 8571 W Easton Rd
- 8122 W Easton Rd
- 9871 Wohlgamuth Rd
- 8609 W Easton Rd
- 10405 Wohlgamuth Rd
- 8691 W Easton Rd
- 10450 Wohlgamuth Rd
- 10490 Wohlgamuth Rd