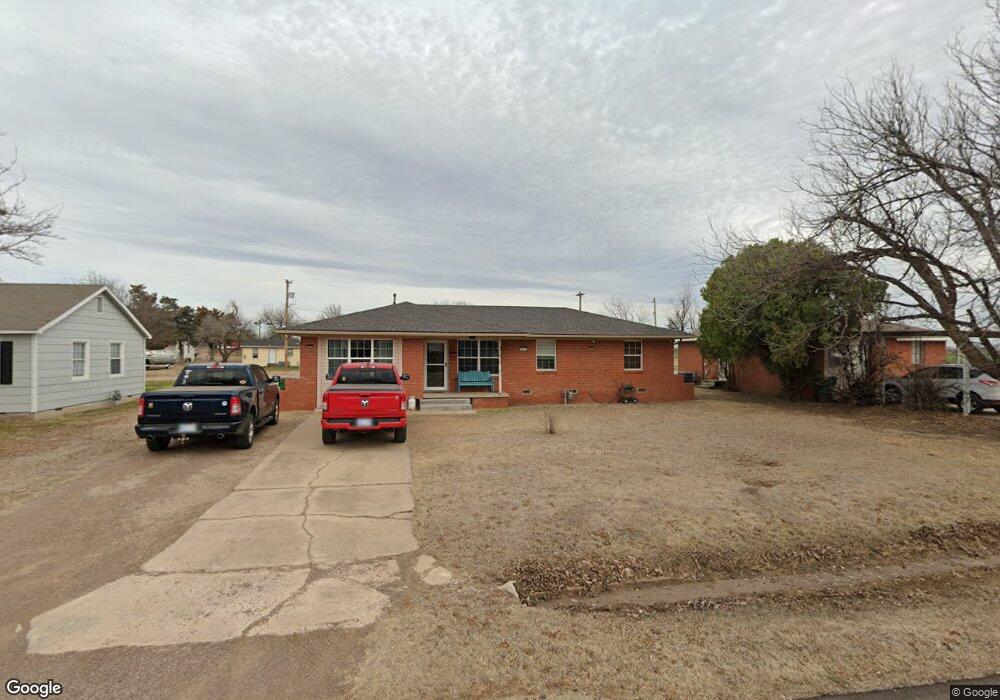
1015 10th St Snyder, OK 73566
Estimated Value: $93,811 - $112,000
3
Beds
2
Baths
1,576
Sq Ft
$68/Sq Ft
Est. Value
About This Home
This home is located at 1015 10th St, Snyder, OK 73566 and is currently estimated at $107,203, approximately $68 per square foot. 1015 10th St is a home located in Kiowa County with nearby schools including Snyder Elementary School and Snyder High School.
Ownership History
Date
Name
Owned For
Owner Type
Purchase Details
Closed on
May 15, 2024
Sold by
Phillips Michael R and Phillips Jo Ann
Bought by
Goldman Wesley and Goldman Colleen L
Current Estimated Value
Home Financials for this Owner
Home Financials are based on the most recent Mortgage that was taken out on this home.
Original Mortgage
$110,000
Outstanding Balance
$107,233
Interest Rate
4%
Mortgage Type
VA
Estimated Equity
-$30
Purchase Details
Closed on
Apr 6, 1999
Sold by
Neagle
Bought by
Phillips
Purchase Details
Closed on
Aug 24, 1993
Sold by
Sparkman
Bought by
Neagle
Create a Home Valuation Report for This Property
The Home Valuation Report is an in-depth analysis detailing your home's value as well as a comparison with similar homes in the area
Purchase History
| Date | Buyer | Sale Price | Title Company |
|---|---|---|---|
| Goldman Wesley | $110,000 | Sovereign Title Services | |
| Phillips | $46,500 | -- | |
| Neagle | $34,000 | -- |
Source: Public Records
Mortgage History
| Date | Status | Borrower | Loan Amount |
|---|---|---|---|
| Open | Goldman Wesley | $110,000 |
Source: Public Records
Tax History
| Year | Tax Paid | Tax Assessment Tax Assessment Total Assessment is a certain percentage of the fair market value that is determined by local assessors to be the total taxable value of land and additions on the property. | Land | Improvement |
|---|---|---|---|---|
| 2025 | $864 | $10,384 | $520 | $9,864 |
| 2024 | $628 | $7,242 | $520 | $6,722 |
| 2023 | $625 | $7,207 | $520 | $6,687 |
| 2022 | $538 | $7,207 | $520 | $6,687 |
| 2021 | $538 | $7,207 | $520 | $6,687 |
| 2020 | $550 | $7,368 | $520 | $6,848 |
| 2019 | $550 | $7,368 | $520 | $6,848 |
| 2018 | $521 | $6,978 | $492 | $6,486 |
| 2017 | $495 | $6,647 | $474 | $6,173 |
| 2016 | $471 | $6,330 | $457 | $5,873 |
| 2015 | $450 | $6,030 | $449 | $5,581 |
| 2014 | $428 | $5,742 | $420 | $5,322 |
Source: Public Records
Map
Nearby Homes
- 1207 B St
- 1601 C St
- TBD N 2250 Rd
- N 2250 Rd
- 22778 Highway 62b
- 16489 Highway 54
- 16475 Oklahoma 54
- TBD E 1670 Rd
- 16485 Highway 54
- 0 16489 Ns County Rd 231 Unit 1214953
- E 1670 Rd
- 0 E 1650 & Ns County Rd 231 Snyder Ok 73566 Unit 1214809
- Highway 183
- 6543 NW 277th St
- 15544 Oklahoma 54
- 15544 U S 54
- W Gore Blvd
- SW Woodland Rd
- 23070 County Road E173
- 300 Becker
Your Personal Tour Guide
Ask me questions while you tour the home.