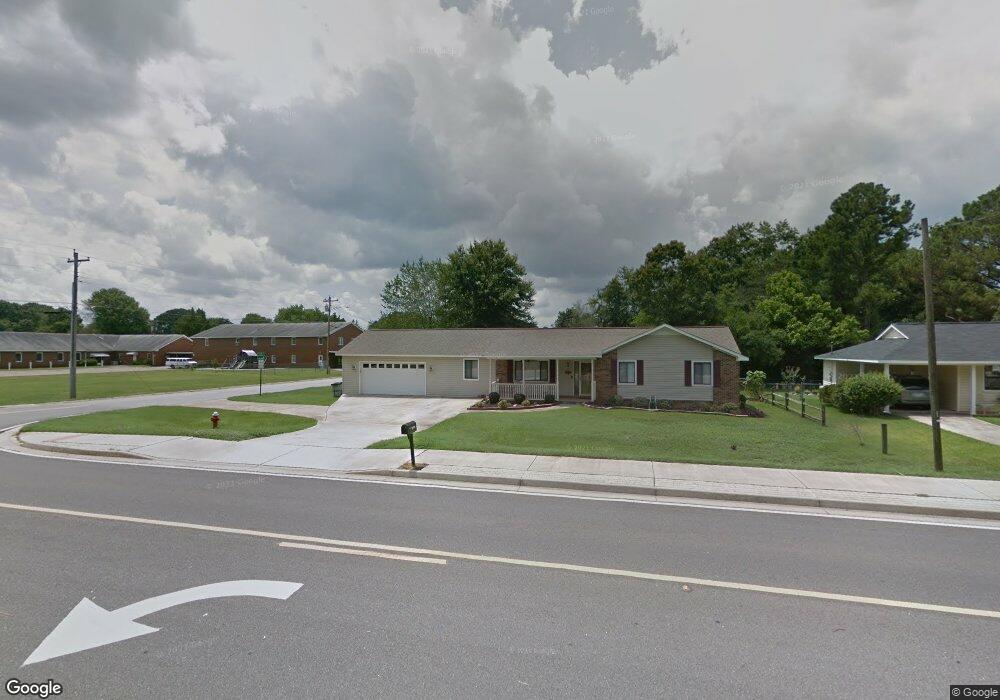
1015 Carl Vinson Pkwy Centerville, GA 31028
Estimated Value: $179,000 - $218,000
3
Beds
2
Baths
1,653
Sq Ft
$122/Sq Ft
Est. Value
About This Home
This home is located at 1015 Carl Vinson Pkwy, Centerville, GA 31028 and is currently estimated at $201,290, approximately $121 per square foot. 1015 Carl Vinson Pkwy is a home located in Houston County with nearby schools including Centerville Elementary School, Northside Middle School, and Northside High School.
Ownership History
Date
Name
Owned For
Owner Type
Purchase Details
Closed on
May 6, 1983
Sold by
Stokes Real Estate Corporation
Bought by
Foskey David W and Foskey Teri B
Current Estimated Value
Purchase Details
Closed on
Feb 3, 1983
Sold by
Citizens State Bank
Bought by
Stokes Real Estate Corporation
Purchase Details
Closed on
Oct 29, 1981
Sold by
Mitchell Billy Builders Inc
Bought by
Citizens State Bank
Purchase Details
Closed on
May 7, 1980
Sold by
Mitchell Billy J
Bought by
Billy Mitchell Builders Inc
Purchase Details
Closed on
May 29, 1979
Sold by
O'Kelley Robert F
Bought by
Mitchell Billy J
Purchase Details
Closed on
Nov 13, 1978
Sold by
Miller Roy M
Bought by
O'Kelley Robert F
Purchase Details
Closed on
May 16, 1978
Sold by
Bateman Brant
Bought by
Miller Roy M
Purchase Details
Closed on
Jul 27, 1976
Sold by
Tall Pines Dev Inc
Bought by
Bateman Brant
Purchase Details
Closed on
Dec 29, 1972
Sold by
Grove Frances B
Bought by
Tall Pines Dev Inc
Create a Home Valuation Report for This Property
The Home Valuation Report is an in-depth analysis detailing your home's value as well as a comparison with similar homes in the area
Home Values in the Area
Average Home Value in this Area
Purchase History
| Date | Buyer | Sale Price | Title Company |
|---|---|---|---|
| Foskey David W | -- | -- | |
| Stokes Real Estate Corporation | -- | -- | |
| Citizens State Bank | -- | -- | |
| Billy Mitchell Builders Inc | -- | -- | |
| Mitchell Billy J | -- | -- | |
| O'Kelley Robert F | -- | -- | |
| Miller Roy M | -- | -- | |
| Bateman Brant | -- | -- | |
| Tall Pines Dev Inc | -- | -- |
Source: Public Records
Tax History Compared to Growth
Tax History
| Year | Tax Paid | Tax Assessment Tax Assessment Total Assessment is a certain percentage of the fair market value that is determined by local assessors to be the total taxable value of land and additions on the property. | Land | Improvement |
|---|---|---|---|---|
| 2024 | $2,410 | $70,800 | $6,480 | $64,320 |
| 2023 | $2,028 | $59,360 | $6,480 | $52,880 |
| 2022 | $1,084 | $49,160 | $5,800 | $43,360 |
| 2021 | $984 | $44,560 | $4,360 | $40,200 |
| 2020 | $833 | $37,840 | $4,360 | $33,480 |
| 2019 | $833 | $37,840 | $4,360 | $33,480 |
| 2018 | $833 | $37,840 | $4,360 | $33,480 |
| 2017 | $833 | $37,840 | $4,360 | $33,480 |
| 2016 | $835 | $37,840 | $4,360 | $33,480 |
| 2015 | $837 | $37,840 | $4,360 | $33,480 |
| 2014 | -- | $37,840 | $4,360 | $33,480 |
| 2013 | -- | $37,840 | $4,360 | $33,480 |
Source: Public Records
Map
Nearby Homes
- 106 Tor Dr
- 136 Scarborough Rd
- 102 Montiego Ct
- 152 Rock Run Trail
- 131 Martin Mill Trail
- 103 Persimmon Glen Ct
- 107 Stonefield Ct
- 94 Tiffany Ln
- 403 Fieldstone Rd
- 102 Pine Glen Ct
- 213 Dogwood Glen
- 208 Pellimore Dr
- 111 Red Oak Glen
- 107 Galahad Dr
- 118 Avalon Dr
- 106 Maple Glen Ct
- 112 Willow Glen
- 102 Heritage Dr
- 1017 Carl Vinson Pkwy
- 102 Scarborough Rd
- 1019 Carl Vinson Pkwy
- 104 Scarborough Rd
- 108 Tumbleweed Cir
- 1021 Carl Vinson Pkwy
- 106 Scarborough Rd
- 106 Tumbleweed Cir
- 1023 Carl Vinson Pkwy Unit A/5
- 1023 Carl Vinson Pkwy
- 110 Tumbleweed Cir
- 108 Scarborough Rd
- 104 Tumbleweed Cir
- 1013 Carl Vinson Pkwy
- 609 Forest Lake Dr
- 1025 Carl Vinson Pkwy
- 110 Scarborough Rd
- 112 Tumbleweed Cir
- 102 Tumbleweed Cir
- 105 Tumbleweed Cir