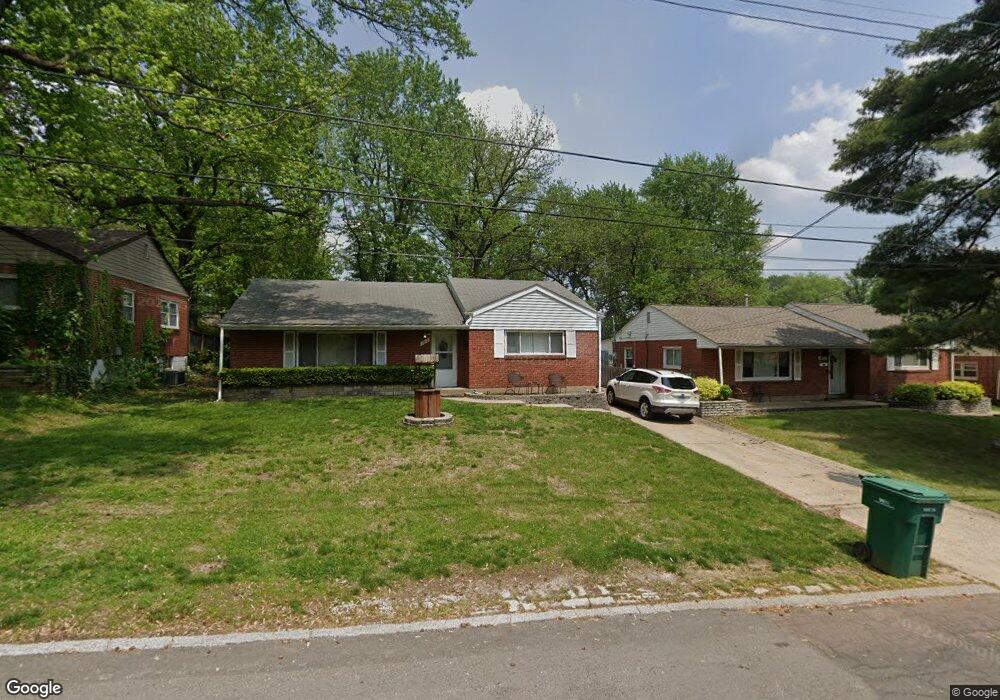
1015 Harrison St Florissant, MO 63031
Estimated Value: $126,000 - $143,000
2
Beds
1
Bath
1,073
Sq Ft
$125/Sq Ft
Est. Value
About This Home
This home is located at 1015 Harrison St, Florissant, MO 63031 and is currently estimated at $134,286, approximately $125 per square foot. 1015 Harrison St is a home located in St. Louis County with nearby schools including Combs Elementary School, Cross Keys Middle School, and McCluer North High School.
Ownership History
Date
Name
Owned For
Owner Type
Purchase Details
Closed on
Dec 15, 2008
Sold by
Crowley Michelle and Crowley Michelle Renee
Bought by
Cash Robert P and Cash Deborah K
Current Estimated Value
Home Financials for this Owner
Home Financials are based on the most recent Mortgage that was taken out on this home.
Original Mortgage
$88,827
Outstanding Balance
$58,864
Interest Rate
6.19%
Mortgage Type
FHA
Estimated Equity
$75,422
Purchase Details
Closed on
Jun 28, 2002
Sold by
Usa Properties Llc
Bought by
Crowley James M
Home Financials for this Owner
Home Financials are based on the most recent Mortgage that was taken out on this home.
Original Mortgage
$69,804
Interest Rate
6.76%
Mortgage Type
FHA
Purchase Details
Closed on
Feb 14, 2002
Sold by
Kempf Michael R
Bought by
Usa Properties
Purchase Details
Closed on
Aug 14, 1999
Sold by
Kempf Michael R and Kempf Nancy L
Bought by
Kempf Michael R and Kempf Nancy L
Purchase Details
Closed on
Jun 1, 1999
Sold by
Ackermann Loretta K
Bought by
Kempf Michael R
Home Financials for this Owner
Home Financials are based on the most recent Mortgage that was taken out on this home.
Original Mortgage
$61,968
Interest Rate
7.21%
Mortgage Type
FHA
Create a Home Valuation Report for This Property
The Home Valuation Report is an in-depth analysis detailing your home's value as well as a comparison with similar homes in the area
Home Values in the Area
Average Home Value in this Area
Purchase History
| Date | Buyer | Sale Price | Title Company |
|---|---|---|---|
| Cash Robert P | $90,000 | Ctc | |
| Crowley James M | $70,900 | -- | |
| Usa Properties | $67,000 | -- | |
| Kempf Michael R | -- | -- | |
| Kempf Michael R | $62,000 | -- |
Source: Public Records
Mortgage History
| Date | Status | Borrower | Loan Amount |
|---|---|---|---|
| Open | Cash Robert P | $88,827 | |
| Previous Owner | Crowley James M | $69,804 | |
| Previous Owner | Kempf Michael R | $61,968 |
Source: Public Records
Tax History Compared to Growth
Tax History
| Year | Tax Paid | Tax Assessment Tax Assessment Total Assessment is a certain percentage of the fair market value that is determined by local assessors to be the total taxable value of land and additions on the property. | Land | Improvement |
|---|---|---|---|---|
| 2025 | $1,639 | $21,020 | $4,410 | $16,610 |
| 2024 | $1,639 | $20,980 | $3,040 | $17,940 |
| 2023 | $1,633 | $20,980 | $3,040 | $17,940 |
| 2022 | $1,358 | $15,260 | $4,410 | $10,850 |
| 2021 | $1,335 | $15,260 | $4,410 | $10,850 |
| 2020 | $1,253 | $13,530 | $3,900 | $9,630 |
| 2019 | $1,229 | $13,530 | $3,900 | $9,630 |
| 2018 | $1,102 | $10,810 | $2,150 | $8,660 |
| 2017 | $1,096 | $10,810 | $2,150 | $8,660 |
| 2016 | $1,384 | $13,380 | $4,050 | $9,330 |
| 2015 | $1,392 | $13,380 | $4,050 | $9,330 |
| 2014 | $1,406 | $13,960 | $3,740 | $10,220 |
Source: Public Records
Map
Nearby Homes
- 940 Harrison St
- 1130 Saint Francois St
- 175 Clark St
- 629 Aubuchon St
- 1290 Saint Louis St
- 260 N Jefferson St
- 305 S Lafayette St
- 1023 Saint Denis St
- 580 Saint Marie St
- 865 Boone St
- 150 Saint Daniel Ln
- 540 S Jefferson St
- 1090 Saint Joseph St
- 1965 Saint Catherine St
- 270 W Saint Anthony Ln
- 279 Elmdale Ct
- 1148 Boone St
- 215 Maple Dr
- 1150 Clark St
- 216 Graham Rd
- 1035 Harrison St
- 995 Harrison St
- 985 Harrison St
- 1055 Harrison St
- 1020 Washington St
- 990 Washington St
- 1040 Washington St
- 965 Harrison St
- 980 Washington St
- 1060 Washington St
- 1020 Harrison St
- 1040 Harrison St
- 990 Harrison St
- 325 N New Florissant Rd
- 305 N New Florissant Rd
- 345 N New Florissant Rd
- 945 Harrison St
- 1060 Harrison St
- 980 Harrison St
- 960 Washington St