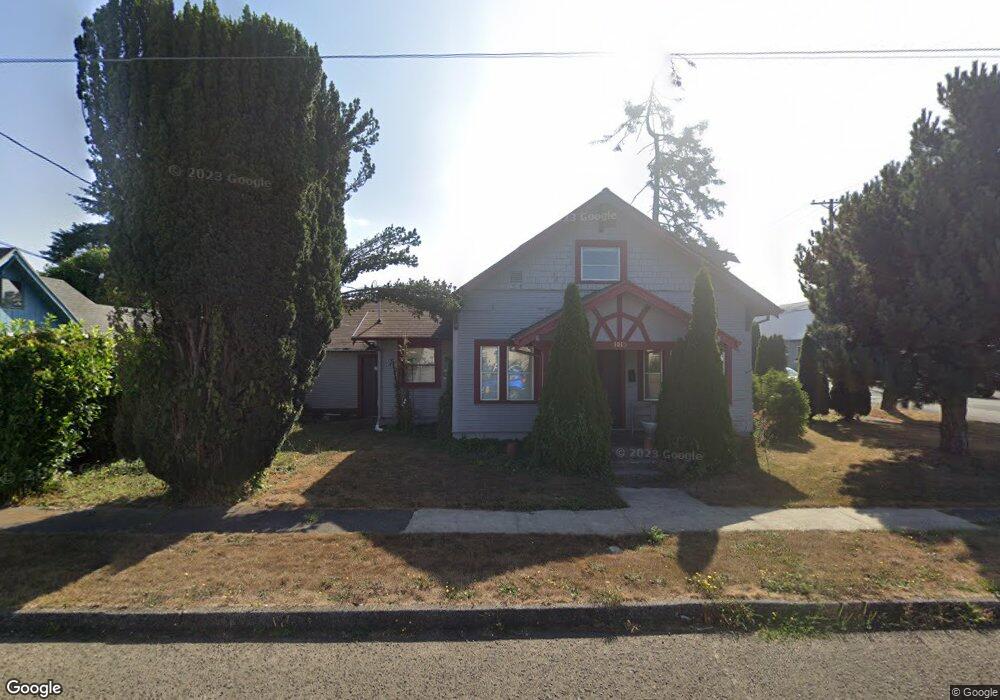
1015 Ivy Ave Tillamook, OR 97141
Estimated Value: $298,582 - $349,000
3
Beds
3
Baths
1,128
Sq Ft
$285/Sq Ft
Est. Value
About This Home
This home is located at 1015 Ivy Ave, Tillamook, OR 97141 and is currently estimated at $321,146, approximately $284 per square foot. 1015 Ivy Ave is a home located in Tillamook County with nearby schools including Tillamook High School, Little Clipper Preschool, and Tillamook Adventist School.
Ownership History
Date
Name
Owned For
Owner Type
Purchase Details
Closed on
Sep 4, 2008
Sold by
Donaldson John and Donaldson Melinda M
Bought by
Price J Wayne and Price Bette L
Current Estimated Value
Home Financials for this Owner
Home Financials are based on the most recent Mortgage that was taken out on this home.
Original Mortgage
$106,000
Outstanding Balance
$70,741
Interest Rate
6.59%
Mortgage Type
Purchase Money Mortgage
Estimated Equity
$250,405
Purchase Details
Closed on
Aug 26, 2008
Sold by
Donaldson Joel
Bought by
Donaldson John and Donaldson Melinda M
Home Financials for this Owner
Home Financials are based on the most recent Mortgage that was taken out on this home.
Original Mortgage
$106,000
Outstanding Balance
$70,741
Interest Rate
6.59%
Mortgage Type
Purchase Money Mortgage
Estimated Equity
$250,405
Purchase Details
Closed on
Dec 9, 2005
Sold by
Mcnutt Pamela J
Bought by
Willamette Valley Properties Inc
Home Financials for this Owner
Home Financials are based on the most recent Mortgage that was taken out on this home.
Original Mortgage
$27,000
Interest Rate
6.14%
Mortgage Type
Seller Take Back
Create a Home Valuation Report for This Property
The Home Valuation Report is an in-depth analysis detailing your home's value as well as a comparison with similar homes in the area
Home Values in the Area
Average Home Value in this Area
Purchase History
| Date | Buyer | Sale Price | Title Company |
|---|---|---|---|
| Price J Wayne | $176,000 | First American | |
| Donaldson John | -- | First American | |
| Willamette Valley Properties Inc | $30,000 | Multiple |
Source: Public Records
Mortgage History
| Date | Status | Borrower | Loan Amount |
|---|---|---|---|
| Open | Price J Wayne | $106,000 | |
| Closed | Donaldson John | $31,500 | |
| Previous Owner | Willamette Valley Properties Inc | $27,000 |
Source: Public Records
Tax History Compared to Growth
Tax History
| Year | Tax Paid | Tax Assessment Tax Assessment Total Assessment is a certain percentage of the fair market value that is determined by local assessors to be the total taxable value of land and additions on the property. | Land | Improvement |
|---|---|---|---|---|
| 2024 | $884 | $74,450 | $43,150 | $31,300 |
| 2023 | $876 | $72,290 | $41,890 | $30,400 |
| 2022 | $846 | $70,190 | $40,670 | $29,520 |
| 2021 | $822 | $68,150 | $39,490 | $28,660 |
| 2020 | $799 | $66,170 | $38,340 | $27,830 |
| 2019 | $779 | $64,250 | $37,220 | $27,030 |
| 2018 | $759 | $62,380 | $36,140 | $26,240 |
| 2017 | $740 | $60,570 | $35,090 | $25,480 |
| 2016 | $713 | $58,810 | $34,070 | $24,740 |
| 2015 | $699 | $57,100 | $33,080 | $24,020 |
| 2014 | $687 | $55,440 | $32,120 | $23,320 |
| 2013 | -- | $53,830 | $31,190 | $22,640 |
Source: Public Records
Map
Nearby Homes
- 1010 Ivy Ave
- 2105 9th St
- 1006 Stillwell Ave
- 1806 8th St
- 1003 Grove Ave
- 1009 Grove Ave
- 1009/1011 Grove Ave Unit 1009-11
- 02600 12th St
- 1412 9th St
- 1706 5th St
- 2417 10th St
- 1703 4th St
- 514 Elm Ave
- 1708 4th St
- 1209 6th St
- 00101 Wilson River Hwy
- 00201 Wilson River Hwy
- TL #00101 Wilson River Hwy
- TL# 02100 Wilson River Hwy
- Parcel 1 Wilson River Hwy