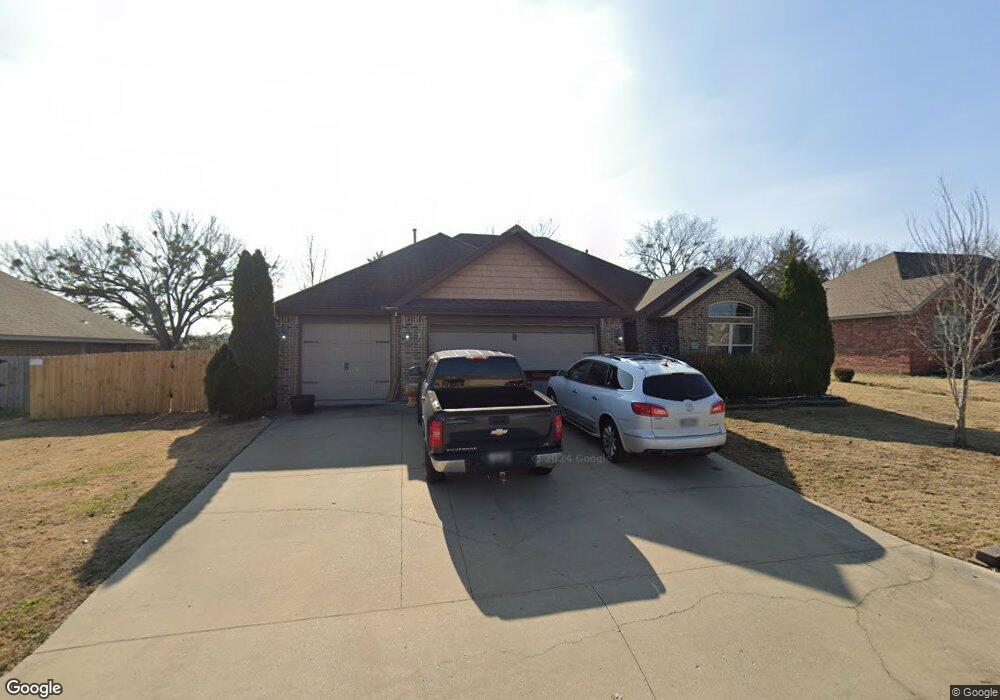
1015 Jessica Leigh St Elkins, AR 72727
Estimated Value: $307,000 - $370,000
4
Beds
2
Baths
1,849
Sq Ft
$188/Sq Ft
Est. Value
About This Home
This home is located at 1015 Jessica Leigh St, Elkins, AR 72727 and is currently estimated at $348,117, approximately $188 per square foot. 1015 Jessica Leigh St is a home located in Washington County with nearby schools including Elkins Elementary Primary School, Elkins Elementary School, and Elkins Middle School.
Ownership History
Date
Name
Owned For
Owner Type
Purchase Details
Closed on
Mar 26, 2012
Sold by
Barnett Jerry W and Barnett Rose S
Bought by
Richert Marla and Richert Duane G
Current Estimated Value
Home Financials for this Owner
Home Financials are based on the most recent Mortgage that was taken out on this home.
Original Mortgage
$125,600
Outstanding Balance
$86,443
Interest Rate
3.91%
Mortgage Type
New Conventional
Estimated Equity
$261,674
Purchase Details
Closed on
Nov 5, 2010
Sold by
Dts Brokerage & Development Llc
Bought by
Barnett Jerry W and Barnett Rose S
Purchase Details
Closed on
Apr 26, 2010
Sold by
Fresh Start Properties Llc
Bought by
Dts Brokerage & Development Llc
Home Financials for this Owner
Home Financials are based on the most recent Mortgage that was taken out on this home.
Original Mortgage
$135,050
Interest Rate
4.88%
Mortgage Type
Construction
Create a Home Valuation Report for This Property
The Home Valuation Report is an in-depth analysis detailing your home's value as well as a comparison with similar homes in the area
Home Values in the Area
Average Home Value in this Area
Purchase History
| Date | Buyer | Sale Price | Title Company |
|---|---|---|---|
| Richert Marla | $160,000 | Lenders Title Company | |
| Barnett Jerry W | $164,000 | Elite Title Company Inc | |
| Dts Brokerage & Development Llc | $26,000 | Kings River Title |
Source: Public Records
Mortgage History
| Date | Status | Borrower | Loan Amount |
|---|---|---|---|
| Open | Richert Marla | $125,600 | |
| Previous Owner | Dts Brokerage & Development Llc | $135,050 |
Source: Public Records
Tax History Compared to Growth
Tax History
| Year | Tax Paid | Tax Assessment Tax Assessment Total Assessment is a certain percentage of the fair market value that is determined by local assessors to be the total taxable value of land and additions on the property. | Land | Improvement |
|---|---|---|---|---|
| 2025 | $3,014 | $67,050 | $7,000 | $60,050 |
| 2024 | $1,678 | $67,050 | $7,000 | $60,050 |
| 2023 | $1,716 | $67,050 | $7,000 | $60,050 |
| 2022 | $1,652 | $40,750 | $5,670 | $35,080 |
| 2021 | $1,471 | $38,760 | $5,670 | $33,090 |
| 2020 | $1,384 | $38,760 | $5,670 | $33,090 |
| 2019 | $1,309 | $30,230 | $4,590 | $25,640 |
| 2018 | $1,334 | $30,230 | $4,590 | $25,640 |
| 2017 | $132 | $30,230 | $4,590 | $25,640 |
| 2016 | $1,319 | $30,230 | $4,590 | $25,640 |
| 2015 | $1,319 | $30,230 | $4,590 | $25,640 |
| 2014 | $1,363 | $31,030 | $4,590 | $26,440 |
Source: Public Records
Map
Nearby Homes
- 567 Jason St
- 1213 Stokenbury Rd
- 430 Saydi St
- 1036 Adysen Ln
- 461 Saydi St
- 445 Saydi St
- 429 Saydi St
- 425 Richland Creek Ave
- 1106 Jennifer Ann Ln
- Tract 1 Smith Rd
- 11.74 AC N Center St
- RC Carnegie II Plan at Stokenbury
- RC Keswick Plan at Stokenbury
- RC Foster II Plan at Stokenbury
- RC Franklin Plan at Stokenbury
- RC Glenwood Plan at Stokenbury
- RC Raleigh Plan at Stokenbury
- RC Kinsley II Plan at Stokenbury
- RC Ross Plan at Stokenbury
- RC Coleman Plan at Stokenbury
- 999 Jessica Leigh St
- 1031 Jessica Leigh St
- 983 Jessica Leigh St
- 1047 Jessica Leigh St
- 1047 Jessica Leigh St
- 1016 Jessica Leigh St
- 1000 Jessica Leigh St
- 880 Stokenbury Rd
- 1032 Jessica Leigh St
- 984 Jessica Leigh St
- 967 Jessica Leigh St
- 1063 Jessica Leigh St
- 1050 Jessica Leigh St
- 968 Jessica Leigh St
- 1013 Ethan James St
- 1029 Ethan James St
- 1079 Jessica Leigh St
- 981 Ethan James St
- 952 Jessica Leigh St
- 997 Ethan James St