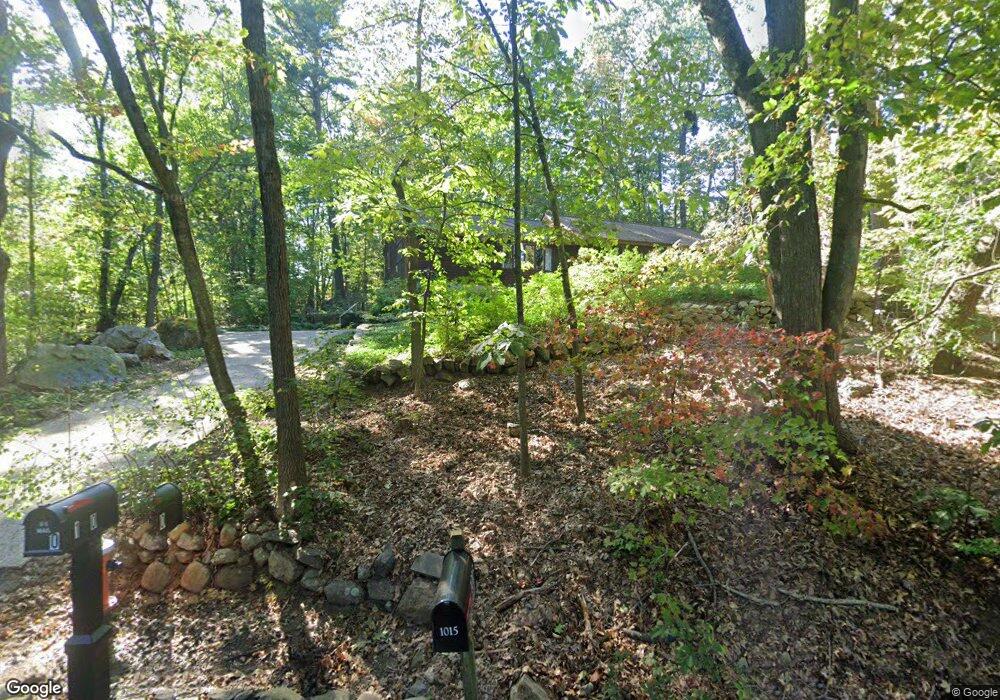
1015 Johnson St North Andover, MA 01845
Estimated Value: $785,000 - $903,000
3
Beds
3
Baths
1,846
Sq Ft
$451/Sq Ft
Est. Value
About This Home
This home is located at 1015 Johnson St, North Andover, MA 01845 and is currently estimated at $832,358, approximately $450 per square foot. 1015 Johnson St is a home located in Essex County with nearby schools including Annie L Sargent Elementary School, North Andover Middle School, and North Andover High School.
Ownership History
Date
Name
Owned For
Owner Type
Purchase Details
Closed on
Oct 10, 2024
Sold by
Lightburn Diane G
Bought by
1015 Johnson Street T and 1015 Lightburn
Current Estimated Value
Purchase Details
Closed on
Feb 9, 2007
Sold by
Lightburn Thomas E
Bought by
Lightburn Thomas E and Lightburn Diane G
Purchase Details
Closed on
Jan 1, 1975
Bought by
Lightburn Thomas E and Lightburn Diane G
Create a Home Valuation Report for This Property
The Home Valuation Report is an in-depth analysis detailing your home's value as well as a comparison with similar homes in the area
Home Values in the Area
Average Home Value in this Area
Purchase History
| Date | Buyer | Sale Price | Title Company |
|---|---|---|---|
| 1015 Johnson Street T | -- | None Available | |
| 1015 Johnson Street T | -- | None Available | |
| Lightburn Thomas E | -- | -- | |
| Lightburn Thomas E | -- | -- | |
| Lightburn Thomas E | -- | -- |
Source: Public Records
Tax History Compared to Growth
Tax History
| Year | Tax Paid | Tax Assessment Tax Assessment Total Assessment is a certain percentage of the fair market value that is determined by local assessors to be the total taxable value of land and additions on the property. | Land | Improvement |
|---|---|---|---|---|
| 2025 | $8,048 | $714,700 | $414,300 | $300,400 |
| 2024 | $7,714 | $695,600 | $392,500 | $303,100 |
| 2023 | $7,493 | $612,200 | $331,500 | $280,700 |
| 2022 | $7,257 | $536,400 | $287,900 | $248,500 |
| 2021 | $6,950 | $490,500 | $261,800 | $228,700 |
| 2020 | $6,430 | $468,000 | $255,200 | $212,800 |
| 2019 | $6,276 | $468,000 | $255,200 | $212,800 |
| 2018 | $6,800 | $468,000 | $255,200 | $212,800 |
| 2017 | $6,088 | $426,300 | $224,600 | $201,700 |
| 2016 | $5,796 | $406,200 | $226,800 | $179,400 |
| 2015 | $5,546 | $385,400 | $213,400 | $172,000 |
Source: Public Records
Map
Nearby Homes
- 1001 Johnson St
- 1029 Johnson St
- 1030 Johnson St
- 1041 Johnson St
- 1174 Turnpike St
- 1174 /32-2 Turnpike St
- 991 Johnson St
- 1180 Turnpike St
- 1010 Johnson St
- 1000 Johnson St
- 1044 Johnson St
- 1057 Johnson St
- 981 Johnson St
- 990 Johnson St
- 1080 Turnpike St
- 1112 Turnpike St
- 1058 Johnson St
- 970 Johnson St
- 967 Johnson St
- 1090 Turnpike St