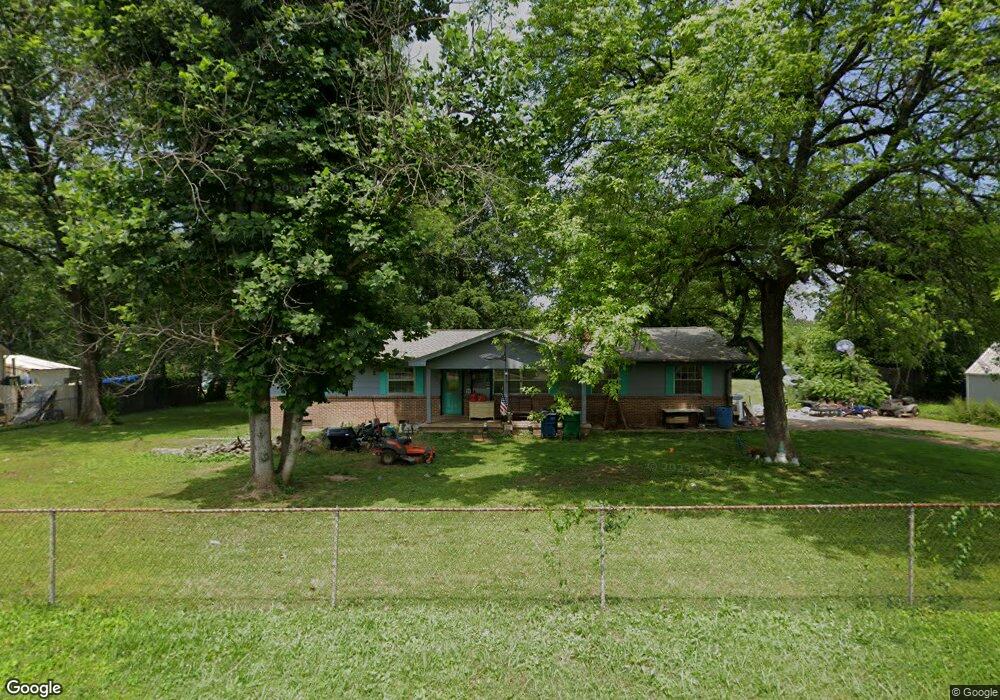
1015 Logan Ave Rossville, GA 30741
Estimated Value: $187,000 - $226,593
3
Beds
2
Baths
1,175
Sq Ft
$176/Sq Ft
Est. Value
About This Home
This home is located at 1015 Logan Ave, Rossville, GA 30741 and is currently estimated at $206,648, approximately $175 per square foot. 1015 Logan Ave is a home located in Walker County with nearby schools including Rossville Elementary School, Rossville Middle School, and Ridgeland High School.
Ownership History
Date
Name
Owned For
Owner Type
Purchase Details
Closed on
Feb 3, 2021
Sold by
Carden Michael Scott
Bought by
Heatherly Robert
Current Estimated Value
Purchase Details
Closed on
Nov 27, 2020
Sold by
Carden Angela Michelle
Bought by
Carden Michael Scott
Purchase Details
Closed on
Jun 24, 2013
Sold by
Webb Gladys M
Bought by
Carden Angela Michelle and Carden Michael S
Purchase Details
Closed on
Oct 29, 2008
Sold by
Not Provided
Bought by
Webb Gladys M and Webb Michelle Carden
Purchase Details
Closed on
Jun 19, 2006
Sold by
Carden Angola
Bought by
Webb Gladys M
Home Financials for this Owner
Home Financials are based on the most recent Mortgage that was taken out on this home.
Original Mortgage
$20,699
Interest Rate
6.57%
Mortgage Type
New Conventional
Purchase Details
Closed on
Mar 29, 1978
Sold by
Lancaster Harold R and Lancaster Nancy
Bought by
Webb James P and Webb Gladys
Purchase Details
Closed on
Jul 23, 1970
Bought by
Lancaster Harold R and Lancaster Nancy
Create a Home Valuation Report for This Property
The Home Valuation Report is an in-depth analysis detailing your home's value as well as a comparison with similar homes in the area
Home Values in the Area
Average Home Value in this Area
Purchase History
| Date | Buyer | Sale Price | Title Company |
|---|---|---|---|
| Heatherly Robert | $80,000 | -- | |
| Carden Michael Scott | -- | -- | |
| Carden Angela Michelle | -- | -- | |
| Webb Gladys M | -- | -- | |
| Webb Gladys M | -- | -- | |
| Webb James P | -- | -- | |
| Lancaster Harold R | -- | -- |
Source: Public Records
Mortgage History
| Date | Status | Borrower | Loan Amount |
|---|---|---|---|
| Previous Owner | Webb Gladys M | $20,699 |
Source: Public Records
Tax History Compared to Growth
Tax History
| Year | Tax Paid | Tax Assessment Tax Assessment Total Assessment is a certain percentage of the fair market value that is determined by local assessors to be the total taxable value of land and additions on the property. | Land | Improvement |
|---|---|---|---|---|
| 2024 | $2,530 | $77,504 | $10,050 | $67,454 |
| 2023 | $2,445 | $74,072 | $10,050 | $64,022 |
| 2022 | $842 | $65,399 | $10,050 | $55,349 |
| 2021 | $1,118 | $38,076 | $10,050 | $28,026 |
| 2020 | $1,055 | $34,384 | $10,050 | $24,334 |
| 2019 | $1,055 | $34,384 | $10,050 | $24,334 |
| 2018 | $1,023 | $34,384 | $10,050 | $24,334 |
| 2017 | $1,143 | $34,384 | $10,050 | $24,334 |
| 2016 | $948 | $34,384 | $10,050 | $24,334 |
| 2015 | $1,216 | $42,018 | $9,900 | $32,118 |
| 2014 | $1,171 | $42,018 | $9,900 | $32,118 |
| 2013 | -- | $42,018 | $9,900 | $32,118 |
Source: Public Records
Map
Nearby Homes
- 1014 Lee Ave
- 916 Logan Ave
- 200 W Oak St
- 816 Indian Ave
- 105 Elm St
- 806 Mcfarland Ave
- 1204 Wooden Ave
- 126 S Liner St
- 4 Carroll Ln
- 405 Miami Ave
- 115 Beech St
- 136 Summit St
- Lot 81 Battle Bluff Dr
- Lot 80 Battle Bluff Dr
- Lot 79 Battle Bluff Dr
- 189 Leinbach Rd
- 164 S Mission Ridge Dr
- 601 James St
- 0 Dempsey Ln Unit 1504691
- 527 W Gordon Ave
- 1017 Logan Ave
- 202 Spruce St
- 206 Spruce St
- 208 Spruce St
- 1012 Lee Ave
- 1014 Logan Ave
- 1008 Lee Ave
- 210 Spruce St
- 1012 Logan Ave
- 1101 Logan Ave
- 116 Spruce St
- 116 Spruce St Unit 1
- 212 Spruce St Unit 1
- 212 Spruce St
- 114 Spruce St
- 0 Spruce St Unit 8156876
- 0 Spruce St
- 216 Spruce St
- 1100 Lee Ave
- 1100 Lee Ave Unit 1