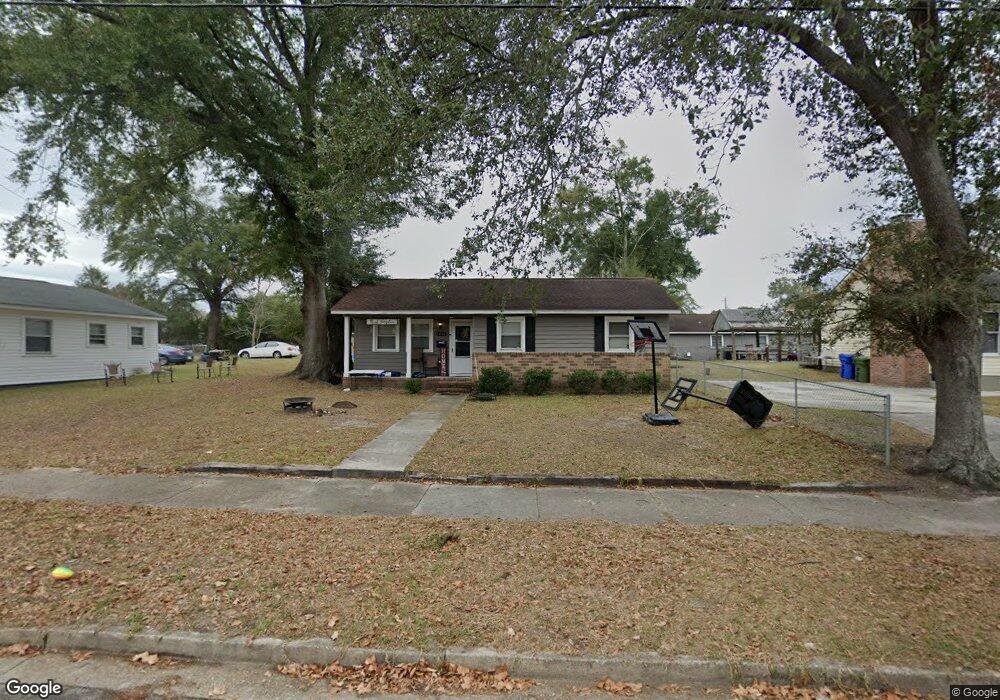
1015 N 8th St Wilmington, NC 28401
Northside NeighborhoodEstimated Value: $249,388 - $269,000
3
Beds
1
Bath
896
Sq Ft
$290/Sq Ft
Est. Value
About This Home
This home is located at 1015 N 8th St, Wilmington, NC 28401 and is currently estimated at $259,597, approximately $289 per square foot. 1015 N 8th St is a home located in New Hanover County with nearby schools including Snipes Academy of Arts & Design, Williston Middle School, and New Hanover High School.
Ownership History
Date
Name
Owned For
Owner Type
Purchase Details
Closed on
Nov 30, 2012
Sold by
S & T Real Estate Inc
Bought by
Swann Properties Llc
Current Estimated Value
Home Financials for this Owner
Home Financials are based on the most recent Mortgage that was taken out on this home.
Original Mortgage
$200,000
Interest Rate
3.4%
Mortgage Type
Purchase Money Mortgage
Purchase Details
Closed on
Sep 30, 2004
Sold by
Masterson Allen L Lynn C
Bought by
S & T Real Estate Inc
Purchase Details
Closed on
Jan 1, 1986
Sold by
City Of Wilm
Bought by
Masterson Allen L Lynn C
Purchase Details
Closed on
Jan 1, 1978
Sold by
City Of Wilm
Bought by
City Of Wilm
Purchase Details
Closed on
Nov 12, 1976
Sold by
Johnson Gladys Kelly
Bought by
Wilm City Of
Purchase Details
Closed on
May 3, 1973
Sold by
Millis Marion W
Bought by
New Han Cnty/Wilm City Of
Create a Home Valuation Report for This Property
The Home Valuation Report is an in-depth analysis detailing your home's value as well as a comparison with similar homes in the area
Home Values in the Area
Average Home Value in this Area
Purchase History
| Date | Buyer | Sale Price | Title Company |
|---|---|---|---|
| Swann Properties Llc | $400,000 | None Available | |
| S & T Real Estate Inc | $600,000 | -- | |
| Masterson Allen L Lynn C | $19,000 | -- | |
| City Of Wilm | -- | -- | |
| Wilm City Of | $800 | -- | |
| New Han Cnty/Wilm City Of | -- | -- |
Source: Public Records
Mortgage History
| Date | Status | Borrower | Loan Amount |
|---|---|---|---|
| Closed | Swann Properties Llc | $200,000 |
Source: Public Records
Tax History Compared to Growth
Tax History
| Year | Tax Paid | Tax Assessment Tax Assessment Total Assessment is a certain percentage of the fair market value that is determined by local assessors to be the total taxable value of land and additions on the property. | Land | Improvement |
|---|---|---|---|---|
| 2024 | $1,316 | $151,300 | $48,600 | $102,700 |
| 2023 | $1,316 | $151,300 | $48,600 | $102,700 |
| 2022 | $1,286 | $151,300 | $48,600 | $102,700 |
| 2021 | $1,295 | $151,300 | $48,600 | $102,700 |
| 2020 | $689 | $65,400 | $31,300 | $34,100 |
| 2019 | $689 | $65,400 | $31,300 | $34,100 |
| 2018 | $689 | $65,400 | $31,300 | $34,100 |
| 2017 | $689 | $65,400 | $31,300 | $34,100 |
| 2016 | $817 | $73,700 | $28,700 | $45,000 |
| 2015 | $780 | $73,700 | $28,700 | $45,000 |
| 2014 | $747 | $73,700 | $28,700 | $45,000 |
Source: Public Records
Map
Nearby Homes