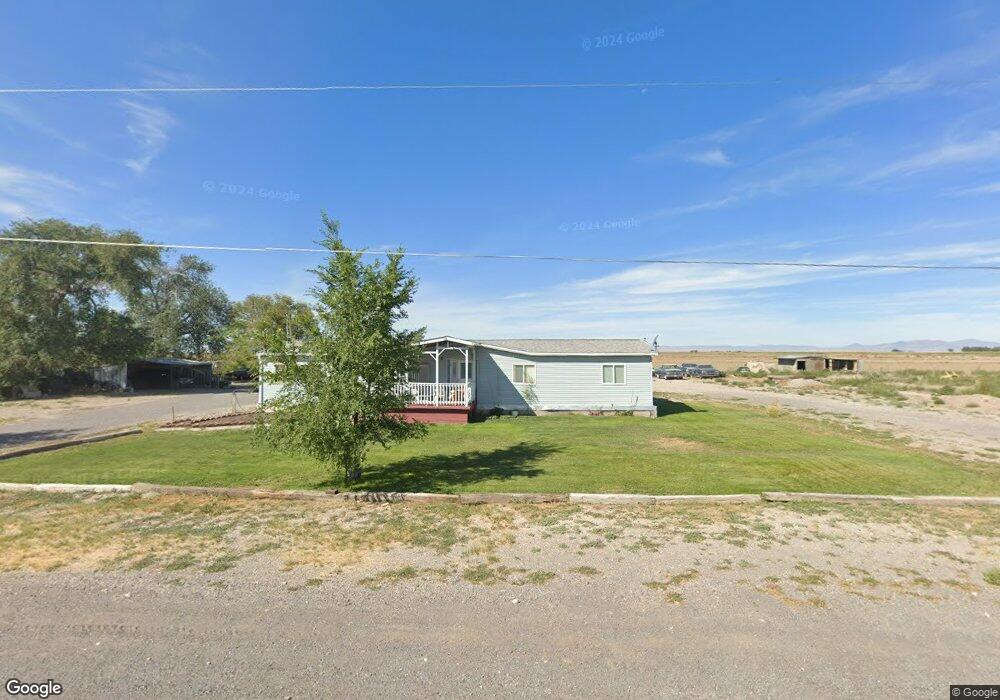
1015 N Main St Hinckley, UT 84635
Estimated Value: $180,000 - $353,000
4
Beds
2
Baths
1,990
Sq Ft
$138/Sq Ft
Est. Value
About This Home
This home is located at 1015 N Main St, Hinckley, UT 84635 and is currently estimated at $275,274, approximately $138 per square foot. 1015 N Main St is a home located in Millard County.
Ownership History
Date
Name
Owned For
Owner Type
Purchase Details
Closed on
Apr 8, 2015
Bought by
Gonzales Castellanos Manuel and Alcaraz Norma
Current Estimated Value
Purchase Details
Closed on
Jan 12, 2015
Sold by
Debra A Debra A
Bought by
Stevens Investments Llc
Purchase Details
Closed on
Jan 24, 2014
Sold by
Jamis M Jamis M
Bought by
Lake Debra A
Purchase Details
Closed on
May 12, 2011
Sold by
Lake Debra A
Bought by
Nielsen Garrett
Home Financials for this Owner
Home Financials are based on the most recent Mortgage that was taken out on this home.
Original Mortgage
$65,725
Interest Rate
4.84%
Purchase Details
Closed on
Mar 27, 2008
Sold by
Deutsche Bank National Compant
Bought by
Lake Debra A
Purchase Details
Closed on
Jan 31, 2008
Sold by
Woodall James H and Goodrich Craig R
Bought by
Long Beach Mortgage Company
Create a Home Valuation Report for This Property
The Home Valuation Report is an in-depth analysis detailing your home's value as well as a comparison with similar homes in the area
Home Values in the Area
Average Home Value in this Area
Purchase History
| Date | Buyer | Sale Price | Title Company |
|---|---|---|---|
| Gonzales Castellanos Manuel | -- | First American Title Insur | |
| Stevens Investments Llc | -- | First Amercan Title Insur | |
| Lake Debra A | $65,725 | -- | |
| Nielsen Garrett | -- | -- | |
| Lake Debra A | -- | -- | |
| Long Beach Mortgage Company | $68,000 | -- |
Source: Public Records
Mortgage History
| Date | Status | Borrower | Loan Amount |
|---|---|---|---|
| Previous Owner | Nielsen Garrett | $65,725 |
Source: Public Records
Tax History Compared to Growth
Tax History
| Year | Tax Paid | Tax Assessment Tax Assessment Total Assessment is a certain percentage of the fair market value that is determined by local assessors to be the total taxable value of land and additions on the property. | Land | Improvement |
|---|---|---|---|---|
| 2025 | $819 | $97,539 | $18,543 | $78,996 |
| 2024 | $819 | $74,029 | $6,442 | $67,587 |
| 2023 | $878 | $74,029 | $6,442 | $67,587 |
| 2022 | $711 | $60,057 | $5,856 | $54,201 |
| 2021 | $525 | $42,249 | $4,880 | $37,369 |
| 2020 | $353 | $28,383 | $4,648 | $23,735 |
| 2019 | $350 | $28,383 | $4,648 | $23,735 |
| 2018 | $341 | $28,383 | $4,648 | $23,735 |
| 2017 | $356 | $28,383 | $4,648 | $23,735 |
| 2016 | $341 | $28,383 | $4,648 | $23,735 |
| 2015 | $336 | $27,884 | $4,648 | $23,236 |
| 2014 | -- | $47,469 | $4,648 | $42,821 |
| 2013 | -- | $46,221 | $4,648 | $41,573 |
Source: Public Records
Map
Nearby Homes
- 700 Acres
- 1500 S 10000 W
- 6000 N 10000 W
- 700 Acres Hwy 6 & Main St (Hwy 50)
- 2000 E 10500 N
- 6200 S 3000 W
- 168 N 100 Rd W
- 289 W Center St S
- 6500 W 2000 S
- 1040 W Center St
- 3480 S 4000 W
- 3770 S 4000 Rd W
- 0 Tbd 3000 Rd S Unit LotWP001
- 6177 S 3000 Rd W
- 17000 W 2500 Rd S
- 16700 W 2500 South Rd
- 16800 W 2500 South Rd
- 3885 W 4500 S
- 470 S 2750 W Unit 6
- 460 S 2750 W Unit 7