Estimated Value: $480,000 - $499,000
3
Beds
2
Baths
1,244
Sq Ft
$393/Sq Ft
Est. Value
About This Home
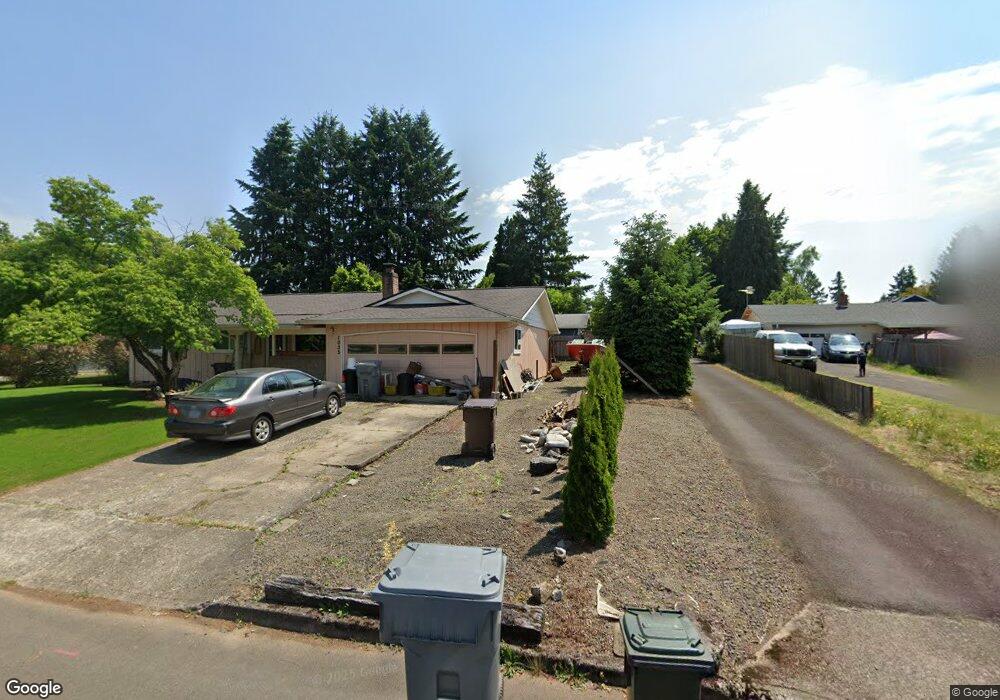
This home is located at 1015 NE 14th Ave, Canby, OR 97013 and is currently estimated at $488,387, approximately $392 per square foot. 1015 NE 14th Ave is a home located in Clackamas County with nearby schools including Josefa L. Sambrano Elementary School, William Knight Elementary School, and Baker Prairie Middle School.
Ownership History
Date
Name
Owned For
Owner Type
Purchase Details
Closed on
Nov 19, 2014
Sold by
Walker Anita B
Bought by
Ward Christopher Andrew Keith and Ward Victoria Anne
Current Estimated Value
Home Financials for this Owner
Home Financials are based on the most recent Mortgage that was taken out on this home.
Original Mortgage
$221,415
Outstanding Balance
$167,533
Interest Rate
3.75%
Mortgage Type
FHA
Estimated Equity
$320,854
Purchase Details
Closed on
Apr 24, 2007
Sold by
Walker Anita B
Bought by
Walker Earl T and Walker Anita B
Purchase Details
Closed on
Aug 18, 2006
Sold by
Ehrich Douglas K and Ehrich Christine A
Bought by
Walker Anita B
Purchase Details
Closed on
Mar 21, 2006
Sold by
Leffler Dorothy
Bought by
Ehrich Douglas K and Ehrich Christine A
Home Financials for this Owner
Home Financials are based on the most recent Mortgage that was taken out on this home.
Original Mortgage
$178,155
Interest Rate
6.62%
Mortgage Type
Fannie Mae Freddie Mac
Create a Home Valuation Report for This Property
The Home Valuation Report is an in-depth analysis detailing your home's value as well as a comparison with similar homes in the area
Home Values in the Area
Average Home Value in this Area
Purchase History
| Date | Buyer | Sale Price | Title Company |
|---|---|---|---|
| Ward Christopher Andrew Keith | $225,500 | Chicago Title Company | |
| Walker Earl T | -- | None Available | |
| Walker Anita B | $256,000 | Chicago Title Insurance Co | |
| Ehrich Douglas K | $197,950 | Chicago Title Co |
Source: Public Records
Mortgage History
| Date | Status | Borrower | Loan Amount |
|---|---|---|---|
| Open | Ward Christopher Andrew Keith | $221,415 | |
| Previous Owner | Ehrich Douglas K | $178,155 |
Source: Public Records
Tax History Compared to Growth
Tax History
| Year | Tax Paid | Tax Assessment Tax Assessment Total Assessment is a certain percentage of the fair market value that is determined by local assessors to be the total taxable value of land and additions on the property. | Land | Improvement |
|---|---|---|---|---|
| 2025 | $4,176 | $235,709 | -- | -- |
| 2024 | $4,059 | $228,844 | -- | -- |
| 2023 | $4,059 | $222,179 | $0 | $0 |
| 2022 | $3,733 | $215,708 | $0 | $0 |
| 2021 | $3,595 | $209,426 | $0 | $0 |
| 2020 | $3,531 | $203,327 | $0 | $0 |
| 2019 | $3,160 | $185,544 | $0 | $0 |
| 2018 | $3,090 | $180,140 | $0 | $0 |
| 2017 | $3,011 | $174,893 | $0 | $0 |
| 2016 | $2,911 | $169,799 | $0 | $0 |
| 2015 | $2,811 | $164,853 | $0 | $0 |
| 2014 | $2,406 | $160,051 | $0 | $0 |
Source: Public Records
Map
Nearby Homes
- 860 NE 14th Ave
- 1009 NE 17th Ave
- 947 NE 17th Ave
- 853 NE 17th Ave
- 878 NE 17th Ave
- 952 NE 17th Ave
- 844 NE 17th Ave
- 838 NE 17th Ave
- 832 NE 17th Ave
- 1750 N Oak St
- 1558 NE 10th Place
- 312 NE 14th Ave
- 1422 NE 18th Place
- 1200 NE Territorial Rd Unit 93
- 1751 N Laurelwood Loop
- 660 NE 20th Ave
- 318 NE 9th Ave
- 1620 N Sweetgum St
- 1552 NE 19th Loop
- 187 NE 14th Ave
- 1035 NE 14th Ave
- 1005 NE 14th Ave
- 1055 NE 14th Ave
- 995 NE 14th Ave
- 1010 NE 13th Ave
- 970 NE 13th Ave
- 1320 N Oak St
- 965 NE 14th Ave
- 1355 N Pine St
- 1020 NE 14th Ave
- 1360 N Oak St
- 1000 NE 14th Ave
- 1040 NE 14th Ave
- 1325 N Pine St
- 930 NE 13th Ave
- 1340 N Oak St
- 1060 NE 14th Ave
- 980 NE 14th Ave
- 1380 N Oak St
- 1405 N Pine St