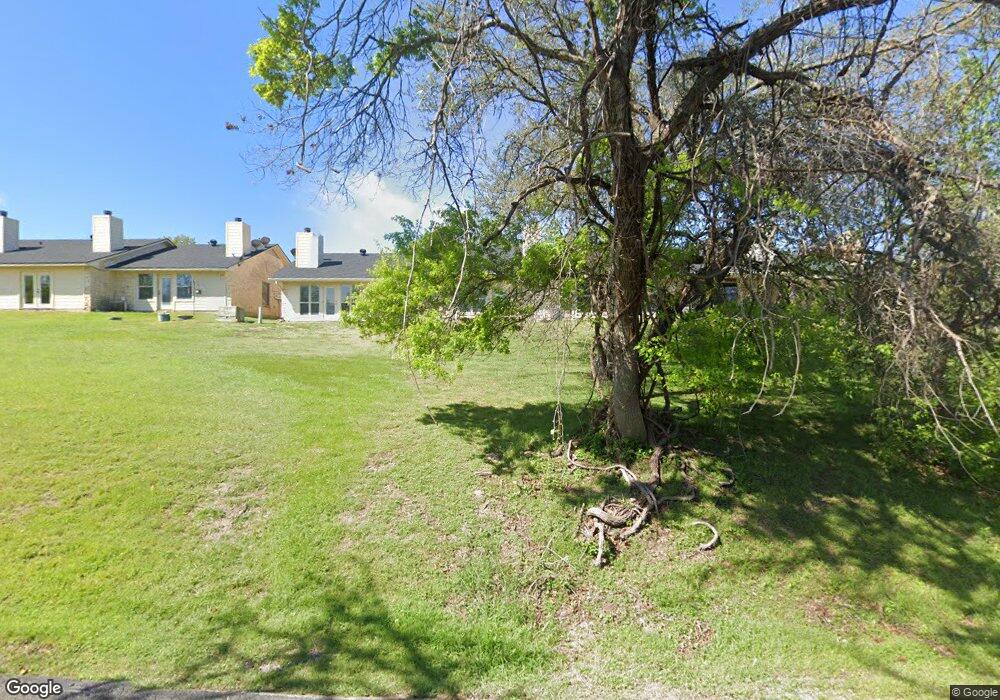
1015 Old Mill Rd Unit 6C Salado, TX 76571
Estimated Value: $145,077 - $224,000
Studio
1
Bath
652
Sq Ft
$283/Sq Ft
Est. Value
About This Home
This home is located at 1015 Old Mill Rd Unit 6C, Salado, TX 76571 and is currently estimated at $184,769, approximately $283 per square foot. 1015 Old Mill Rd Unit 6C is a home located in Bell County with nearby schools including Thomas Arnold Elementary School, Salado Junior High School, and Salado High School.
Ownership History
Date
Name
Owned For
Owner Type
Purchase Details
Closed on
Jan 29, 2024
Sold by
Laquita Johnny and Arner Johnnie Laquita
Bought by
Lively Robin L and Goodfellow Christy A
Current Estimated Value
Purchase Details
Closed on
Nov 20, 2019
Sold by
Lefebvre Jean Jacques and Lefebvre Patricia
Bought by
Goodfellow Scott Jeffrey and Goodfellow Christy Arner
Home Financials for this Owner
Home Financials are based on the most recent Mortgage that was taken out on this home.
Original Mortgage
$77,400
Interest Rate
3.5%
Mortgage Type
New Conventional
Purchase Details
Closed on
Sep 22, 2015
Sold by
Cooper Fairy June
Bought by
Lefebvre Jean Jacques and Lefebvre Patricia
Purchase Details
Closed on
Jun 16, 2008
Sold by
Massey Frankie L and Massey Frankie Lee
Bought by
Cooper Fairy June and Fairy June Cooper Living Trust
Create a Home Valuation Report for This Property
The Home Valuation Report is an in-depth analysis detailing your home's value as well as a comparison with similar homes in the area
Home Values in the Area
Average Home Value in this Area
Purchase History
| Date | Buyer | Sale Price | Title Company |
|---|---|---|---|
| Lively Robin L | -- | None Listed On Document | |
| Goodfellow Scott Jeffrey | -- | None Available | |
| Lefebvre Jean Jacques | -- | None Available | |
| Cooper Fairy June | -- | Monteith Abstract & Title Co |
Source: Public Records
Mortgage History
| Date | Status | Borrower | Loan Amount |
|---|---|---|---|
| Previous Owner | Goodfellow Scott Jeffrey | $77,400 |
Source: Public Records
Tax History
| Year | Tax Paid | Tax Assessment Tax Assessment Total Assessment is a certain percentage of the fair market value that is determined by local assessors to be the total taxable value of land and additions on the property. | Land | Improvement |
|---|---|---|---|---|
| 2025 | $2,777 | $143,783 | $4,974 | $138,809 |
| 2024 | $3,016 | $143,783 | $4,974 | $138,809 |
| 2023 | $2,580 | $131,064 | $9,000 | $122,064 |
| 2022 | $2,077 | $95,161 | $9,000 | $86,161 |
| 2021 | $1,966 | $84,111 | $8,800 | $75,311 |
| 2020 | $2,116 | $84,684 | $8,800 | $75,884 |
| 2019 | $1,975 | $85,614 | $8,800 | $76,814 |
| 2018 | $1,619 | $73,099 | $8,800 | $64,299 |
| 2017 | $1,482 | $66,735 | $4,950 | $61,785 |
| 2016 | $1,444 | $65,004 | $4,950 | $60,054 |
| 2015 | $1,265 | $67,374 | $4,950 | $62,424 |
| 2014 | $1,265 | $65,645 | $0 | $0 |
Source: Public Records
Map
Nearby Homes
- 717 Willow Creek Rd
- 1120 Old Mill Rd
- 608 Ridgecrest Dr
- 3 & 4 Park Dr
- 700 Arrowhead Dr
- 1111 Mill Creek Dr
- 19621a Farm To Market Road 2115
- 1219 Indian Trail
- 1207 Rylee Ln
- 1306 Rylee Ln
- 1312 Rylee Ln
- 1301 Rylee Ln
- 1313 Rylee Ln
- 800 Hillcrest Dr
- 1710 Old Mill Rd Unit 12
- 9249 Creekside Dr
- 3912 Chisholm Trail
- 600 de Grummond Way
- 3900 Chisholm Trail
- 901 Blaylock Dr
- 1015 Old Mill Rd Unit 3A
- 1015 Old Mill Rd Unit 4E
- 1015 Old Mill Rd Unit 1C
- 1015 Old Mill Rd Unit 5E
- 1015 Old Mill Rd Unit 4A
- 1015 Old Mill Rd Unit 6G
- 1015 Old Mill Rd Unit 6F
- 1015 Old Mill Rd Unit 5A
- 1015 Old Mill Rd Unit 6E
- 1015 Old Mill Rd Unit 6D
- 1015 Old Mill Rd Unit 1A
- 1015 Old Mill Rd Unit 5B
- 1015 Old Mill Rd Unit 2A
- 1015 Old Mill Rd Unit 4D
- 1015 Old Mill Rd Unit 2C
- 1015 Old Mill Rd Unit 3E
- 1015 Old Mill Rd Unit 2B
- 1015 Old Mill Rd Unit 3D
- 1015 Old Mill Rd Unit 1B
- 1015 Old Mill Rd Unit 6B
Your Personal Tour Guide
Ask me questions while you tour the home.