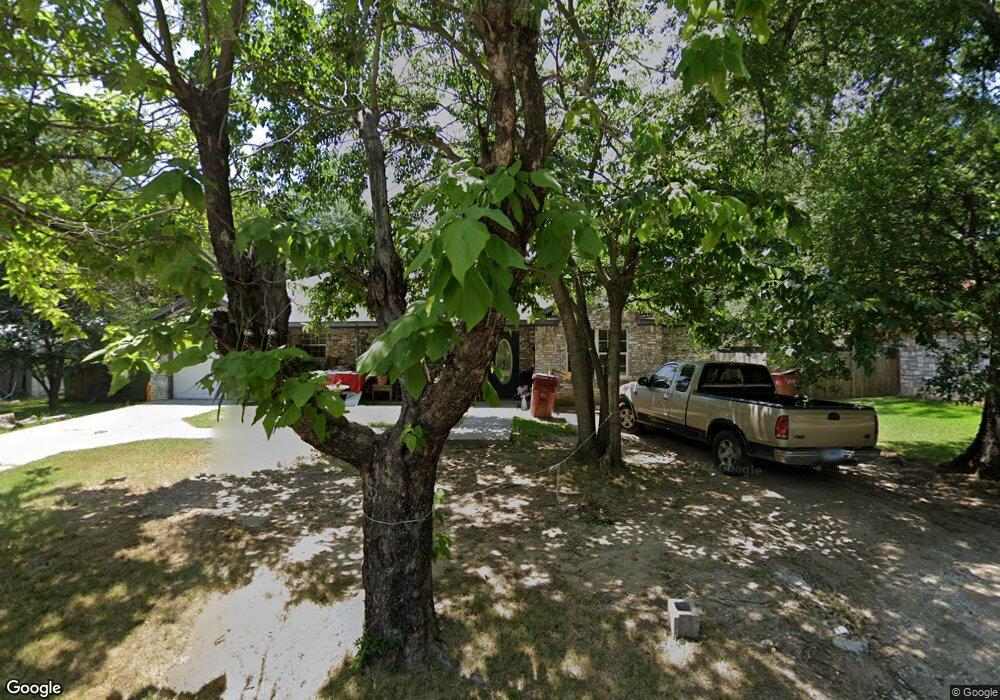
1015 Pine St Bonham, TX 75418
Estimated Value: $218,869 - $239,000
Studio
--
Bath
1,585
Sq Ft
$143/Sq Ft
Est. Value
About This Home
This home is located at 1015 Pine St, Bonham, TX 75418 and is currently estimated at $225,967, approximately $142 per square foot. 1015 Pine St is a home located in Fannin County with nearby schools including Evans Elementary School, Finley-Oates Elementary School, and LH Rather Jr High School.
Ownership History
Date
Name
Owned For
Owner Type
Purchase Details
Closed on
Aug 3, 2005
Sold by
Kelton Raymond E and Kelton Danny Ray
Bought by
Greer Frances M
Current Estimated Value
Home Financials for this Owner
Home Financials are based on the most recent Mortgage that was taken out on this home.
Original Mortgage
$84,060
Interest Rate
6.23%
Mortgage Type
Purchase Money Mortgage
Create a Home Valuation Report for This Property
The Home Valuation Report is an in-depth analysis detailing your home's value as well as a comparison with similar homes in the area
Purchase History
| Date | Buyer | Sale Price | Title Company |
|---|---|---|---|
| Greer Frances M | -- | Cole Title Company | |
| Greer Frances M | -- | None Available |
Source: Public Records
Mortgage History
| Date | Status | Borrower | Loan Amount |
|---|---|---|---|
| Previous Owner | Greer Frances M | $84,060 |
Source: Public Records
Tax History
| Year | Tax Paid | Tax Assessment Tax Assessment Total Assessment is a certain percentage of the fair market value that is determined by local assessors to be the total taxable value of land and additions on the property. | Land | Improvement |
|---|---|---|---|---|
| 2025 | $4,178 | $241,980 | $46,800 | $195,180 |
| 2024 | $1,536 | $253,000 | $44,780 | $208,220 |
| 2023 | $3,511 | $247,540 | $41,980 | $205,560 |
| 2022 | $3,560 | $224,350 | $29,560 | $194,790 |
| 2021 | $3,719 | $169,230 | $14,110 | $155,120 |
| 2020 | $3,419 | $157,360 | $11,200 | $146,160 |
| 2019 | $3,232 | $148,300 | $9,740 | $138,560 |
| 2018 | $2,934 | $132,560 | $9,520 | $123,040 |
| 2017 | $2,569 | $108,130 | $5,040 | $103,090 |
| 2016 | $2,335 | $91,360 | $5,040 | $86,320 |
| 2015 | -- | $83,950 | $4,810 | $79,140 |
| 2014 | -- | $84,850 | $3,900 | $80,950 |
Source: Public Records
Map
Nearby Homes
Your Personal Tour Guide
Ask me questions while you tour the home.