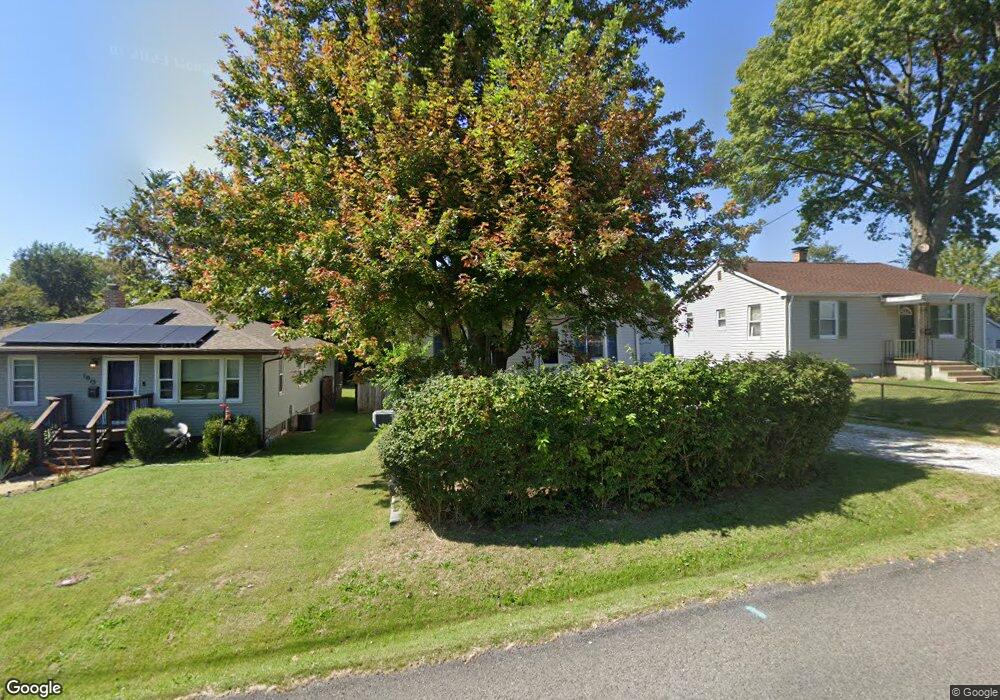
1015 Portland Ave Collinsville, IL 62234
Estimated Value: $121,000 - $141,000
3
Beds
1
Bath
784
Sq Ft
$170/Sq Ft
Est. Value
About This Home
This home is located at 1015 Portland Ave, Collinsville, IL 62234 and is currently estimated at $133,140, approximately $169 per square foot. 1015 Portland Ave is a home located in Madison County with nearby schools including John A Renfro Elementary School, Dorris Intermediate School, and Collinsville Middle School.
Ownership History
Date
Name
Owned For
Owner Type
Purchase Details
Closed on
May 19, 2016
Sold by
Busch Michelle L
Bought by
Michelle Busch Trust and Busch Michelle
Current Estimated Value
Purchase Details
Closed on
Aug 10, 2007
Sold by
Mueth David A and Mueth Valarie L
Bought by
Busch Michelle L
Home Financials for this Owner
Home Financials are based on the most recent Mortgage that was taken out on this home.
Original Mortgage
$73,200
Interest Rate
6.69%
Mortgage Type
Purchase Money Mortgage
Purchase Details
Closed on
Jul 22, 2005
Sold by
Reimler Corey L and Reimler Tina M
Bought by
Mueth David A and Mueth Valarie L
Home Financials for this Owner
Home Financials are based on the most recent Mortgage that was taken out on this home.
Original Mortgage
$86,200
Interest Rate
6.35%
Mortgage Type
Purchase Money Mortgage
Create a Home Valuation Report for This Property
The Home Valuation Report is an in-depth analysis detailing your home's value as well as a comparison with similar homes in the area
Home Values in the Area
Average Home Value in this Area
Purchase History
| Date | Buyer | Sale Price | Title Company |
|---|---|---|---|
| Michelle Busch Trust | -- | None Available | |
| Busch Michelle L | $91,500 | Abstracts & Titles Inc | |
| Mueth David A | $86,000 | Abstracts & Titles Inc |
Source: Public Records
Mortgage History
| Date | Status | Borrower | Loan Amount |
|---|---|---|---|
| Previous Owner | Busch Michelle L | $73,200 | |
| Previous Owner | Mueth David A | $86,200 |
Source: Public Records
Tax History Compared to Growth
Tax History
| Year | Tax Paid | Tax Assessment Tax Assessment Total Assessment is a certain percentage of the fair market value that is determined by local assessors to be the total taxable value of land and additions on the property. | Land | Improvement |
|---|---|---|---|---|
| 2024 | $2,236 | $34,970 | $7,200 | $27,770 |
| 2023 | $2,236 | $32,360 | $6,660 | $25,700 |
| 2022 | $2,130 | $28,990 | $5,960 | $23,030 |
| 2021 | $1,467 | $27,240 | $5,600 | $21,640 |
| 2020 | $1,395 | $25,990 | $5,340 | $20,650 |
| 2019 | $1,344 | $25,100 | $5,160 | $19,940 |
| 2018 | $1,374 | $24,800 | $4,870 | $19,930 |
| 2017 | $1,366 | $24,300 | $4,770 | $19,530 |
| 2016 | $1,430 | $24,300 | $4,770 | $19,530 |
| 2015 | $1,323 | $23,670 | $4,650 | $19,020 |
| 2014 | $1,323 | $23,670 | $4,650 | $19,020 |
| 2013 | $1,323 | $23,670 | $4,650 | $19,020 |
Source: Public Records
Map
Nearby Homes
- 1210 Constance St
- 1227 Ridge Ave
- 501 Spring
- 706 Illinois Ave
- 1120 Williams St
- 892 Lester Ave
- 919 Vine St
- 308 Brown Ave
- 921 Prospect St
- 203 Greenfield Dr
- 1002 California Ave
- 617 N Morrison Ave
- 1224 Cedar Ridge Ct
- 0 N Keebler Ave
- 238 Mill St
- 102 Toni Ct
- 123 W Wickliffe Ave
- 1322 Leland St
- 300 Pine Lake Rd Unit 6
- 300 Pine Lake Rd Unit 7
- 1013 Portland Ave
- 1017 Portland Ave
- 1009 Portland Ave
- 1024 Vermont Ave
- 1020 Vermont Ave
- 1021 Portland Ave
- 1028 Vermont Ave
- 1016 Vermont Ave
- 0 Portland Ave
- 1114 Portland Ave
- 1007 Portland Ave
- 1116 Portland Ave
- 1112 Portland Ave
- 1032 Vermont Ave
- 1012 Vermont Ave
- 1118 Portland Ave
- 1023 Portland Ave
- 1120 Portland Ave
- 1110 Portland Ave
- 1110 Portland Ave