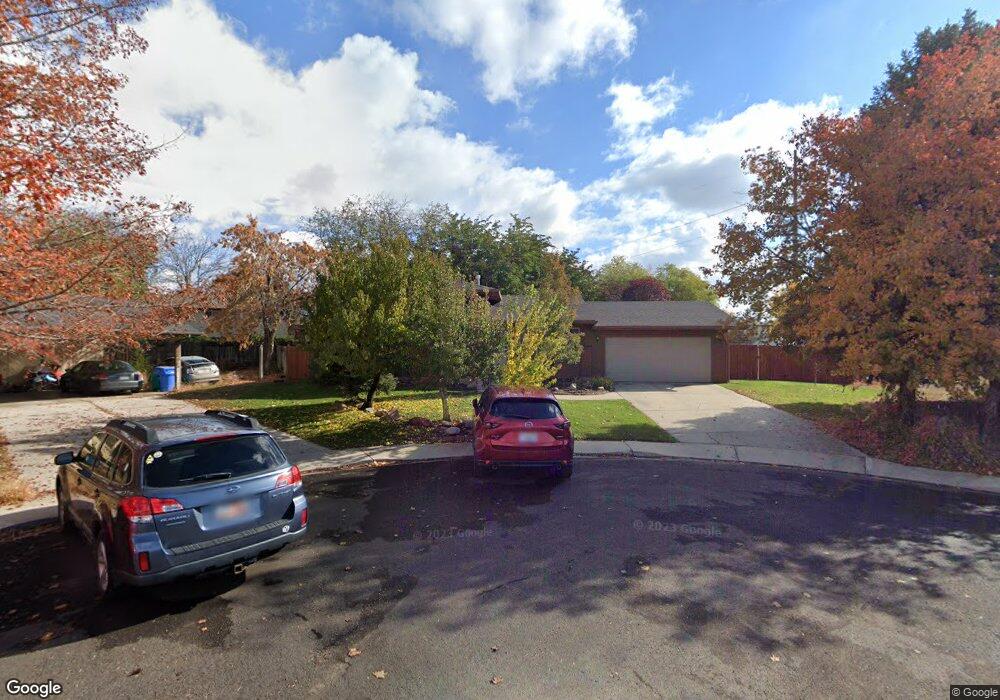
1015 W 1140 N Orem, UT 84057
Bonneville NeighborhoodEstimated Value: $477,000 - $521,208
6
Beds
2
Baths
1,890
Sq Ft
$266/Sq Ft
Est. Value
About This Home
This home is located at 1015 W 1140 N, Orem, UT 84057 and is currently estimated at $502,069, approximately $265 per square foot. 1015 W 1140 N is a home located in Utah County with nearby schools including Bonneville Elementary School, Orem Junior High School, and Timpanogos High School.
Ownership History
Date
Name
Owned For
Owner Type
Purchase Details
Closed on
Feb 27, 2001
Sold by
Olney Greg N and Olney Jennifer C
Bought by
Knight Jared and Knight Ladonna K K
Current Estimated Value
Home Financials for this Owner
Home Financials are based on the most recent Mortgage that was taken out on this home.
Original Mortgage
$92,500
Outstanding Balance
$33,581
Interest Rate
6.98%
Estimated Equity
$468,488
Purchase Details
Closed on
Sep 29, 1999
Sold by
Cary Donald J and Carey Kara J
Bought by
Olney Greg N and Olney Jennifer C
Home Financials for this Owner
Home Financials are based on the most recent Mortgage that was taken out on this home.
Original Mortgage
$135,185
Interest Rate
7.97%
Mortgage Type
FHA
Purchase Details
Closed on
Dec 21, 1998
Sold by
Carey Donald J and Carey Kara Jo
Bought by
Carey Donald J and Carey Kara Jo
Create a Home Valuation Report for This Property
The Home Valuation Report is an in-depth analysis detailing your home's value as well as a comparison with similar homes in the area
Home Values in the Area
Average Home Value in this Area
Purchase History
| Date | Buyer | Sale Price | Title Company |
|---|---|---|---|
| Knight Jared | -- | First American Title Co | |
| Olney Greg N | -- | Sundance Title Insurance | |
| Carey Donald J | -- | -- |
Source: Public Records
Mortgage History
| Date | Status | Borrower | Loan Amount |
|---|---|---|---|
| Open | Knight Jared | $92,500 | |
| Previous Owner | Olney Greg N | $135,185 |
Source: Public Records
Tax History
| Year | Tax Paid | Tax Assessment Tax Assessment Total Assessment is a certain percentage of the fair market value that is determined by local assessors to be the total taxable value of land and additions on the property. | Land | Improvement |
|---|---|---|---|---|
| 2025 | $1,928 | $256,740 | -- | -- |
| 2024 | $1,928 | $235,785 | $0 | $0 |
| 2023 | $1,786 | $234,685 | $0 | $0 |
| 2022 | $1,804 | $229,680 | $0 | $0 |
| 2021 | $1,679 | $323,800 | $159,800 | $164,000 |
| 2020 | $1,523 | $288,600 | $127,800 | $160,800 |
| 2019 | $1,390 | $273,900 | $127,800 | $146,100 |
| 2018 | $1,316 | $247,900 | $116,900 | $131,000 |
| 2017 | $1,249 | $125,950 | $0 | $0 |
| 2016 | $1,235 | $114,895 | $0 | $0 |
| 2015 | $1,192 | $104,885 | $0 | $0 |
| 2014 | $1,161 | $101,695 | $0 | $0 |
Source: Public Records
Map
Nearby Homes
- 999 W 1100 N
- 1062 N 1035 W
- 1123 N 800 W
- 1069 N 1160 W
- 930 N 980 W
- 1140 W 950 N Unit D302
- 1140 W 950 N Unit D304
- 1140 W 950 N Unit A401
- 1405 N 770 W
- 1535 N 950 W
- 1167 W 1550 N
- 1499 N 1200 W Unit 8
- 582 W 1300 N
- 545 W 1240 N
- 538 W 1120 N
- 967 W 1630 N
- 531 W 1350 N
- 686 N 835 W
- 954 W 630 N Unit 34,
- 1545 N State St Unit 1
Your Personal Tour Guide
Ask me questions while you tour the home.